Statistics, Love, and African American History!
The U.S. Census Bureau’s Statistics in Schools program celebrates the month with engaging resources for Valentine’s Day and African American History Month. Use these data- driven materials in your classroom to enhance your student’s statistical literacy skills.
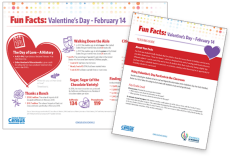
Showing Love on Valentine's Day
Valentine’s Day is a special holiday set aside to express affection and appreciation to your loved ones. Having trouble deciding what gift to purchase or where to shop? In 2016, there were 21,693 jewelry stores and 13,188 flower shops across the United States. Take a closer look at our Valentine’s Day Fun Facts and discover other gift ideas and interesting facts related to the holiday. You can also take it a step further with the complimentary teaching guide that shares fun classroom activities for all grade levels!
A Closer Look at African American History Month!
The Start of National African American History Month
American historian Carter G. Woodson established African American History Week to commemorate the contributions to our nation made by African Americans. The first celebration took place on February 12,1926. In 1976, African American History Week was expanded to African American History Month. U.S. presidents have declared February as National African American History month ever since.
Looking at the Data!
47.4 million The black population, either alone or in combination with one or more other races (July 1, 2017).
Source: Vintage 2017 Population Estimates, Table PEPALL5N
About 87 percent—The percentage of the black population with a high school diploma or higher in 2017.
Source: CPS Historical Time Series Tables
Approximately 24 percent—The percentage of the black population with a bachelor’s degree or higher in 2017.
Source: CPS Historical Time Series Tables
2.1 million—The number of black people aged 25 and over that attained an advanced degree in 2017.
Source: 2017 American Community Survey, Table B15002B
2.7 million—The number of black people enrolled in undergraduate college in 2017.


