
Official websites use .gov
A .gov website belongs to an official government organization in the United States.
Secure .gov websites use HTTPS
A lock (
) or https:// means you’ve safely connected to the .gov website. Share sensitive information only on official, secure websites.

Activities
Resources
Standards
About
Walking Into August With Family Fun, Reading and Rollercoaster Rides!
Getting ready to go back to school? Not so fast. There’s still time to have fun and tie special events happening in August with real-life data from the U.S. Census Bureau to boost statistical and civic literacy. From a little trivia fun with a census Kahoot! game to discovering the total number of rollercoasters in the United States and building a family tree, we are here to help make learning fun with data-filled resources.
Happy Family Fun Month!
From spending a day at the beach to having a little trivia fun, there are plenty of ways to celebrate the month! Check out these Statistics in Schools (SIS) resources to help keep your students engaged while spending quality time with their loved ones.

Kahoot! Games
Students can have some family fun playing our Kahoot! games featuring kid-friendly Census Bureau data on everything from the U.S. population to U.S. businesses. The games are not only a blast, but they’re also educational. While playing, kids learn fun facts like the percentage of people age 25 and older whose highest level of education was high school; the most populous state in 1790 (during the young nation’s first decennial census); and the total number of U.S. amusements parks!

My Family Tree
Taking a trip down memory lane with an open discussion about your family’s history is always nice. Use the My Family Tree activity to construct a family tree and explore the first time you and your relatives were counted in a census. A great way to recognize and show honor to family members.
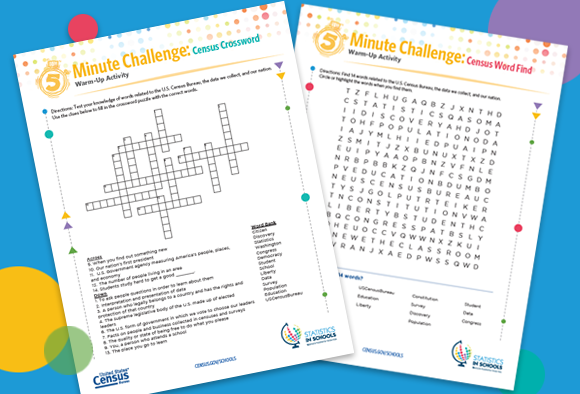
Crossword and Word Find
How familiar are you with census-related terms? Expand your students’ knowledge with the word find and crossword warm-up activities. Students can learn terms related to population, education and other data we collect.
Book Lover’s Day – August 9
Reading is a great way to enhance your vocabulary and learn new things. Celebrate Book Lover’s Day with our "To Kill a Mockingbird": An Introduction to 1930s America activity. This resource introduces statistics and events from the 1930s, when the novel takes place and the nation was in the throes of the Great Depression. For this activity, students will take a look at unemployment numbers from the 1930s and write a piece using the RAFT (role, audience, format, topic) technique to make inferences about the novel’s plot, setting, and conflict.

National Roller Coaster Day – August 16

It’s National Roller Coaster Day! Can you guess how many amusement parks there are in the United States? Be sure to share our Using Fractions to Compare Amusement Parks by States activity with your students and learn fun facts like the total number of amusement parks in their state and the nation. Students can write the numbers as fractions and create a visual model of the data.
Back to School Time!
Did you know that over 46 million students were enrolled in public K-12 schools in the U.S. in fall 2022? Or that people with a bachelor’s degree made over $84,000 a year in 2022? Discover these and other school-related facts using the Back to School Fun Facts handout. Students can learn the average yearly salaries of workers age 18 and older based on their education level and more. Check out the accompanying teaching guide for ideas on ways to use these fun facts in lessons like having students create a bar graph using data in the handout’s “Gearing Up for School” section.
Activity of the Month
SIS has a variety of standards-based activities for all grade levels. In this section of our newsletter, an SIS staff member has handpicked one of their favorites for you to explore.
Discover the Adopting an Entrepreneurial Mindset -- Using Census Data for Business high school history activity:
Finding the best location to start a business is among the key things people must consider when starting a business. In this activity, students imagine they own gas stations across the country. Using the Census Business Builder data access tool, students gather and analyze information to determine whether New York County, New York, or a neighboring county is the best place to open this business. Students will look at different variables related to gas stations and their potential customers to help make their decision. For example, one question asks students what else, other than information available in the tool, do they still need to know before deciding where to open a gas station. Students might consider the cost of living in each county; the number of people in each county who typically use public transportation; and how other gas stations in each county perform.

Why This Activity Is a Staff Favorite
This activity is a great way to get students to think like entrepreneurs! Some students may aspire to be business owners one day and this activity does a great job of walking them through things to consider and provides a tool that can help them prepare.
The activity includes step-by-step instructions on how to gather data and organize them using a graphic organizer. As an extension to the activity, students can complete the activity with a business type and location of their choice. As we move towards becoming a more data-driven world this will be a good way to help prepare students for life after high school!
Page Last Revised - August 8, 2024
✕
Is this page helpful?
 Yes
Yes
 No
No
 Yes
Yes
 No
No✕
NO THANKS
255 characters maximum
 255 characters maximum reached
✕
Thank you for your feedback.
Comments or suggestions?

Comments or suggestions?