
Official websites use .gov
A .gov website belongs to an official government organization in the United States.
Secure .gov websites use HTTPS
A lock (
) or https:// means you’ve safely connected to the .gov website. Share sensitive information only on official, secure websites.

Topics
Data & Maps
Surveys & Programs
Resource Library
SAIPE Interactive Data Tool - Supporting Information
SAIPE Interactive Data Tool - Supporting Information
Overview
The SAIPE Interactive Data Tool supports data lookup, downloading, mapping, and trend visualization for the following concepts:
- Poverty estimates at the School District, County, and State levels.
- Median Household Income estimates at the County and State levels.
Data Sources
Income and Poverty Estimates
Geographic Boundaries
Two Types of School District Maps
- Detailed School District Boundary Reference Maps
- Quick access to detailed school district boundary reference maps via the 'Map' link on the rightmost column of the school-district data tables.
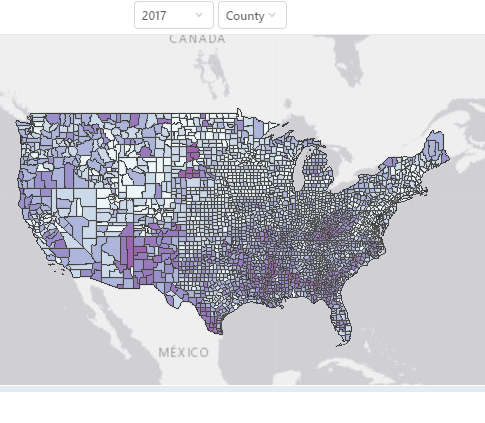
- Thematic Maps
- Color-shaded maps indicate ranges of poverty-ratio estimates and median household income estimates.
- The boundaries are smoothed ("generalized") and so are not "detailed" boundaries. As a result, these rough shapes often do not correspond with the exact boundaries.
Using SAIPE
Below are some links that are useful for becoming familiar with SAIPE:
About the Tool
The tool was developed using Javascript and ESRI ArcGIS server 10.5
Related Information
DATA TOOL
Income and Poverty Interactive Data Tool
Page Last Revised - October 8, 2021
✕
Is this page helpful?
 Yes
Yes
 No
No
 Yes
Yes
 No
No✕
NO THANKS
255 characters maximum
 255 characters maximum reached
✕
Thank you for your feedback.
Comments or suggestions?

Comments or suggestions?