
Official websites use .gov
A .gov website belongs to an official government organization in the United States.
Secure .gov websites use HTTPS
A lock (
) or https:// means you’ve safely connected to the .gov website. Share sensitive information only on official, secure websites.

Topics
Data & Maps
Surveys & Programs
Resource Library
2022 Economic Census Methodology
2022 Economic Census Methodology
In This Section:
Target population
The target population of the Economic Census consists of all establishments (generally single physical locations where business is conducted or where services or industrial operations are performed) that:
- are in operation for at least some part of 2022,
- are located in one of the 50 U.S. states, associated offshore areas, or the District of Columbia,
- have paid employees,
- are classified in one of nineteen in-scope sectors defined by the 2022 North American Industry Classification System (NAICS), and
- are not government-owned unless they are classified in one of the following NAICS industries:
- Wine and Distilled Alcoholic Beverage Merchant Wholesalers
- Beer, Wine, and Liquor Retailers
- Tobacco, Electronic Cigarette, and Other Smoking Supplies Retailers
- Book Publishers
- Monetary Authorities-Central Bank
- Hospitals
- Gambling Industries
- Casino Hotels
Note that establishments located in Puerto Rico, the U.S. Virgin Islands, Guam, the Commonwealth of the Northern Mariana Islands, or America Samoa are in the target population of the Economic Census of Island Areas, which has different methodology, documented on the Island Areas methodology webpage.
The 2022 Economic Census covers the following NAICS sectors of the U.S. economy:
- 11 – Agriculture, Forestry, Fishing and Hunting (new for 2022)
- 21 – Mining, Quarrying, and Oil and Gas Extraction
- 22 – Utilities
- 23 – Construction
- 31-33 – Manufacturing
- 42 – Wholesale Trade
- 44-45 – Retail Trade
- 48-49 – Transportation and Warehousing
- 51 – Information
- 52 – Finance and Insurance
- 53 – Real Estate and Rental and Leasing
- 54 – Professional, Scientific and Technical Services
- 55 – Management of Companies and Enterprises
- 56 – Administrative and Support and Waste Management and Remediation Services
- 61 – Educational Services
- 62 – Health Care and Social Assistance
- 71 – Arts, Entertainment, and Recreation
- 72 – Accommodation and Food Services
- 81 – Other Services (except Public Administration)
More detailed descriptions of these sectors can be found at the Census Bureau NAICS webpage.
The following industries (NAICS) are not covered by the 2022 Economic Census:
- 111 – Crop Production
- 112 – Animal Production and Aquaculture
- 113 – Forestry and Logging
- 114 – Fishing, Hunting and Trapping
- 1153 – Support Activities for Forestry
- 482 – Rail Transportation
- 491 – Postal Service
- 525 – Funds, Trusts, and Other Financial Vehicles
- 6111 – Elementary and Secondary Schools
- 6112 – Junior Colleges
- 6113 – Colleges, Universities, and Professional Schools
- 8131 – Religious Organizations
- 81393 – Labor Unions and Similar Labor Organizations
- 81394 – Political Organizations
- 814 – Private Households
- 92 – Public Administration
Sampling frame
The Economic Census selects establishments for its sample from a frame obtained from the U.S. Census Bureau’s Business Register. The Business Register contains information on the physical location of establishments, as well as payroll, employment, receipts (value of shipments), and industry classification data obtained from prior censuses and surveys or obtained from the administrative records of the Internal Revenue Service (IRS) and Social Security Administration (SSA) under special arrangements which safeguard the confidentiality of both tax and census records. Information from the Bureau of Labor Statistics on industry classifications is also used to supplement the classification information from the IRS and SSA.
To be included on the sampling frame, an establishment was required to satisfy the following conditions:
- it must be classified into an in-scope NAICS industry according to the 2017 NAICS definitions,
- it must be an active establishment of a multi-establishment firm, or it must be a single-establishment firm with at least one quarter of 2022 administrative payroll or 2021Q4 administrative payroll, and
- it must be located in one of the 50 U.S. states, associated offshore areas, or the District of Columbia.
Sample Design
The sample component of the 2022 Economic Census consists of four parts:
- All active operating establishments of multi-establishment firms (“Multi-Estab”).
- All single-establishment firms whose annualized payroll was above an industry-specific payroll cutoff (“Large Certainty”).
- Certain single-establishment firms taken with certainty for some specific reason (“Special Certainty”).
- A stratified sample selected from the remaining, generally smaller, single-establishment firms (“Non-Certainty”).
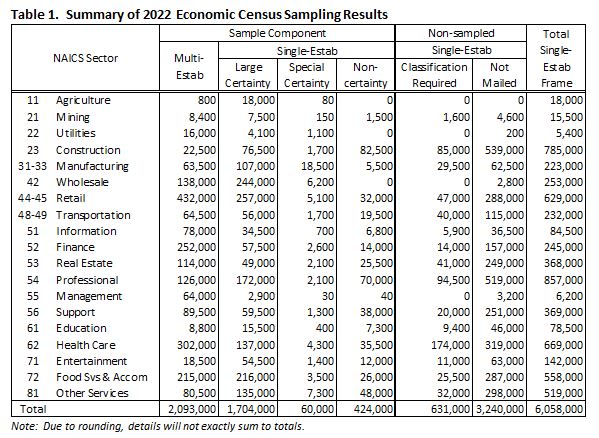
To reduce respondent burden and costs, the Census Bureau did not require all establishments to complete a Census questionnaire. For tabulations of basic data items (receipts, payroll, employment, etc.) administrative data of these, generally smaller, single-establishment firms are used. Establishments that were not required to complete a Census questionnaire are referred to as the “non-sampled component” of the 2022 Economic Census. This non-sampled component consists of:
- Small single-establishment firms included on the sampling frame but not selected into the Census sample. Although not included in the sample, some of these establishments received an Economic Census request for industry classification information so that their administrative data could be accurately tabulated in the correct industry. Table 1 column “Classification Required” indicates the number of single-establishment firms that were required to provide this classification information. The remaining single-establishment firms were not contacted for the Economic Census (“Not Mailed” column in Table 1).
- Single-establishment firms with no existing classification information. There were approximately 40,000 of these firms and while they were not included in the sample, they were asked to provide industry classification information only.
- Any single-establishment firms that started business operations so late in 2022 (mostly in the 4th quarter) that their 2022 administrative payroll was not received by the Census Bureau until after the 2022 sample was selected – roughly 110,000 firms.
The table below shows the sizes of each of the sample components and the first non-sampled component from the bulleted list, above. The last column (“Total Single-Estab Frame”) shows the total number of single-establishment firms that were on the sampling frame.
Selection procedures differ between multi- and single-establishment firms.
Multi-Establishment Firms
Any firm with more than one active establishment is included in the Economic Census with certainty and is generally expected to report for all its establishments. Each establishment is included with certainty and assigned a sample weight of 1.
Establishment Reporting Units
In most industries, multi-establishment firms are required to complete an industry-specific questionnaire for each of the establishments in their firm.
Alternative Reporting Units (ARU) for Selected Industries
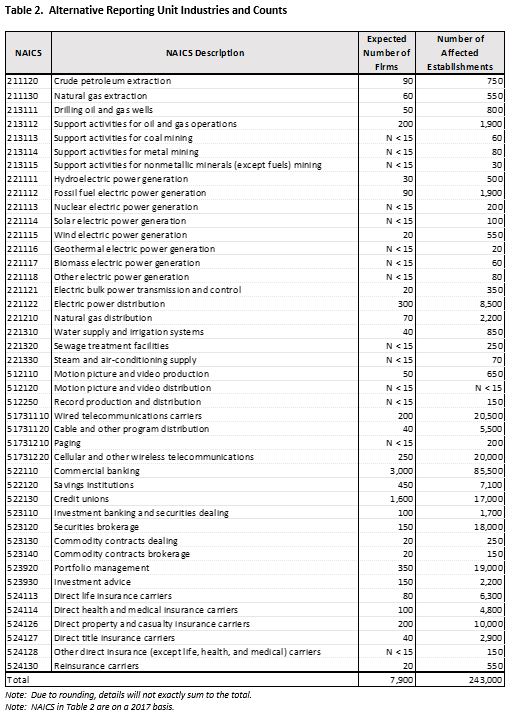
In some industries, firms have difficulty reporting revenue and related data for each of their business locations (establishments). However, they can provide firm-level industry totals with relative ease, and they can report separate payroll and employment information for each business location within the industry. Table 2 shows the industries for which an alternative questionnaire was used and the expected number of affected firms.
If a firm had more than two establishments in one of the industries listed below, the firm received one questionnaire for each of those industries. Each questionnaire requested consolidated, firm-level data for revenue and related measures covering the firm’s nationwide operations. A supplementary questionnaire enumerated the firm’s establishments in the industry and requested payroll and employment information for each of them.
Single-Establishment Firms with 2022 Payroll
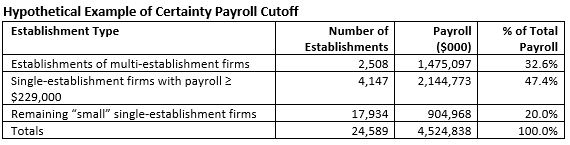
The sample design for single-establishment firms began with a study of the potential respondent universe. This study produced a set of industry-specific payroll cutoffs that were used to distinguish large single-establishment firms from small ones within each industry. In general, these cutoffs were chosen so that the sum of the payroll of the multi-establishment firms plus the payroll of the single-establishment firms above the cutoff equaled 75 - 95% of the total payroll in an industry, though there were exceptions. In the hypothetical example below, a payroll cutoff of $229,000 for an industry will result in 80% of total industry payroll (32.6% + 47.4%) being contained within the 6,655 establishments (2,508 + 4,147) selected with certainty.
The single-establishment firm sample selection had three phases: identifying the “large” single-establishment firms including some firms with special characteristics, selecting a sample of the “small” single-establishment firms, and determining if additional classification information was needed from the non-selected single-establishment firms.
Identifying “Large” Single-Establishment Firms
All single-establishment firms with annualized administrative payroll that equaled or exceeded the certainty payroll cutoff for their industry were included in the sample component of the Economic Census with certainty. Each had a probability of selection of 1, and a sample weight of 1, which applies only for producing industry-specific statistics where data are not available from administrative records. Note that “Large” is relative. In some industries, this payroll cutoff was zero and all establishments were selected into the sample.
In addition, certain single-establishment firms were included with certainty, regardless of size, based on other characteristics. These included firms that were likely cooperatives and firms included in the Annual Survey of Manufactures (ASM).
Sampling “Small” Single-Establishment Firms
The remaining single-establishment firms (those with annualized payroll below the cutoff for their industry) were stratified by industry and state and selected using a strata-specific probability of selection.
The probabilities of selection for these strata were determined by a study of the potential respondent universe conducted shortly before sample selection operations began. Selected small single-establishment firms were included in the sample as non-certainty cases. Each had a probability of selection that generally fell within the range of 0.8 to 0.05. In industry by state strata containing fewer than five establishments, all were included in the sample (not applicable to mining and construction sectors).
Determining Which Establishments Need Classification Information
All remaining (non-sampled) single-establishment firms with payroll were represented in the Economic Census by data from federal administrative records or through imputation and were not usually required to respond. However, in some cases, the industry classification information on the Business Register – used to tabulate the (quantitative) administrative data in the correct industry – is inadequate or outdated. The most common reasons for a deficient classification were administrative classification data provided to the Census Bureau lacking sufficient detail to assign an establishment to a publication level NAICS industry, or the administrative data were not in agreement regarding an establishment’s classification.
Sample maintenance
After the initial sample selection in September 2022, a second sample of single-establishment firms was selected in November 2022 from those establishments on the Business Register with 2022 payroll that were not on the initial sampling frame. Similarly, a third sample of single-establishment firms was selected in March 2023 from those establishments on the Business Register with 2022 payroll that were not included on the previous two sampling frames. Any single-establishment firms that started business so late in 2022 that their administrative data was not available to the Census Bureau in time for the last sampling operation were not included in the data collection but were included in the tabulations using their administrative data or via imputation.
Data items requested and reference period covered
The reference period is the year 2022. Information for businesses selected into the Economic Census can be found at https://www.census.gov/programs-surveys/economic-census/information.html. The 2022 Census questionnaires are available at 2022 Economic Census Survey Repository.
Respondents are given a choice from a preselected list when asked for their establishment's primary business/activity. For the 2017 Economic Census, a respondent could provide a write-in response if none of the options were appropriate. For the 2022 Economic Census, this write-in response was connected to a machine learning algorithm that allowed the respondent to select the correct primary business/activity from additional options generated by the submitted response. Additionally, for single-establishment firms, the specific set of questions asked in the remainder of the 2022 Economic Census may vary based on the given response for primary business/activity rather than instead of being predetermined.
Frequency and mode of contact
The 2022 Economic Census was collected entirely online. Paper questionnaires were made available for establishments located in the island areas. See the IA methodology for more details. Respondents were contacted in January of 2023 with an initial survey letter requesting their participation online. Respondents also received a reminder letter prior to the March 15 due date. Up to five “past due” follow-ups were sent via mail and multiple email follow-ups were sent to companies that had started, but not yet completed, the reporting process online. Select companies also received reminder calls via telephone. Initial and follow-up letters can be found under respondent materials.
Data collection unit
For all single-establishment firms and most multi-establishment firms, the data collection unit (also referred to as the ‘reporting unit’) is the establishment. As mentioned previously in the Sample design section above, in certain industries, multi-establishment firms have difficulty reporting revenue and related data for each of their establishments. These firms received a special questionnaire that requested consolidated, firm-level data for revenue and related measures. A supplementary questionnaire listed the firm’s establishments in the industry and requested payroll and employment information for each of them.
Special procedures
For the third nonresponse follow-up mailing, a certified letter was mailed to roughly one-half of the single-establishment firm nonrespondents (with the other nonrespondents receiving a regular letter). The nonrespondents to receive the certified letter were selected using a process that identified industry by state combinations where the response was poorest and selecting a larger proportion of nonrespondents from those combinations.
For the fourth nonresponse follow-up mailing, single-establishment firm nonrespondents that did not receive a certified letter in the third follow-up received either a certified letter or a letter by Priority Mail.
Editing
Data captured in an Economic Census must be edited to identify and correct reporting errors. The data also must be adjusted to account for missing items and for businesses that do not respond. Data edits detect and validate data by considering factors such as proper classification for a given record, historical reporting for the record, and industry/geographic ratios and averages.
The first step of the data editing process is classification. To assign a valid kind-of-business or industry classification code to the establishment, computer programs subject their responses to a series of data edit programs. The specific items used for classification depend on the census report forms and include:
- self-designated kind-of-business check-box classifications,
- responses to product lines sold by an establishment,
- products manufactured by a plant, and
- entries written in by the respondent explaining the establishment’s activities.
If critical information is missing, the record is flagged and fixed by analysts before further processing occurs.
If all critical information is available, the classification code is assigned automatically. After classification codes are assigned, a "verification" operation is performed to validate the industry and geography.
After an establishment has been assigned a valid industry code, the data edits further evaluate the response data for consistency and validity—for example, ensuring that employment data are consistent with payroll or sales/receipts data. Response data is always evaluated by industry; in some cases, type of operation or tax-exempt status is also taken into account. Additional checks compare current year data to data reported in previous censuses, annual surveys, or from administrative sources.
Nonresponse
Nonresponse is defined as the inability to obtain requested data from an eligible survey unit. Two types of nonresponse are often distinguished. Unit nonresponse is the inability to obtain any of the substantive measurements about a unit. In most cases of unit nonresponse, the Census Bureau was unable to obtain any information from the survey unit after several attempts to elicit a response. Item nonresponse occurs either when a question is unanswered or the reported data is unusable.
Nonresponse adjustment and imputation
Nonresponse is handled by estimating or imputing missing data. Imputation is defined as the replacement of a missing or incorrectly reported item with another value derived from logical edits or statistical procedures.
The primary methods for imputing missing basic data items (such as receipts/sales, payroll, and employment) are:
- using administrative data,
- deriving the missing data item from the establishment’s other data (either reported or administrative),
- deriving the missing data item using 2017 Economic Census data, and
- obtaining the information from another Census Bureau survey.
Estimation
Economic Census tabulations for basic statistics (receipts, payroll, employment, etc.) are simple summations of data from all in-scope establishments using reported data collected from the Economic Census, plus administrative records data or imputed data for nonrespondents and single-establishment firms that were not selected into the Economic Census sample. The most common source of imputed data is administrative data from the IRS. For multi-establishment firms in alternative reporting industries (see the Sample design section above), the consolidated firm level receipts data is first allocated to the individual establishments of the firm in the industry.
Estimates involving ARU industries are treated differently in two ways. In the 2017 Economic Census, any estimates of sales, value of shipments, or revenue below the national level for any of the ARU industries were suppressed, appearing on tables with either a ‘Q’ flag, which has the note “Revenue not collected at this level of detail for multiestablishment firms.” Estimates for aggregate-level industries that included an ARU industry appeared with an ‘N’ flag, which has the note “Not available or not comparable.” Despite those suppressions, we did calculate estimates for lower levels of geography by proportionally allocating the firm-level responses for sales, value of shipments, or revenue to individual establishments. Starting with the 2022 Economic Census, we will no longer suppress these estimates after continued review of those allocated values of sales, value of shipments, or revenue indicated the allocated values were comparable in quality to other methods of imputation. 2017 estimates on comparative tables will retain the ‘Q’ and ‘N’ flags.
Suppressions remain using ‘Q’ and ‘N’ flags remain in place in the 2022 Economic Census for estimates of number of establishments with activity in specific products defined by NAPCS-based collection codes. Firm-level responses make it impossible to estimate the number of establishments with specific product activity.
Economic Census estimates for industry-specific statistics, such as product statistics and other industry-specific special items, are derived by summing weighted data, where each certainty establishment (establishments of multi-establishment firms and “large” single-establishment firms) has a weight of 1, and each non-certainty establishment has the sample weight assigned during the sample selection process (see above). These initial weighted estimates are further adjusted to ensure that these detailed estimates sum to the basic statistics total. To do this, we calculate weighted estimates for the corresponding basic statistic. The published estimate for the industry-specific item is then calculated by dividing the weighted estimate for the industry-specific item by the weighted estimate of the basic statistic and then multiplying the resulting quotient by the published basic statistic based on all establishments.
List of weighted estimates by table
EC2223BASIC:
- FEDDL (Value of construction work on federally owned projects), CSLDL (Value of construction work on state and locally owned projects), PRIDL (Value of construction work on privately owned projects), RCPOTH (Value of other business done), and RCPCCNDL (Value of construction work subcontracted in from others) are all associated with the basic statistic RCPTOT (Sales, value of shipments, or revenue).
- RCPGDL (Value of construction work on government owned projects) is derived as the sum of FEDDL and CSLDL, and RCPCWRK (Value of construction work) is derived as the sum of FEDDL, CSLDL, and PRIDL.
- RCPNCW (Net value of construction work) is derived as RCPCWRK minus CSTSCNT (Cost of construction work subcontracted out to others)
Dollar values are published in current dollars. In tables that compare the current Economic Census to prior Economic Census statistics, no adjustment has been made to the estimates to account for inflation during the intervening period.
Sampling error
The sampling error of an estimate based on a sample survey is the difference between the estimate and the result that would be obtained from a complete census conducted under the same survey conditions. This error occurs because characteristics differ among sampling units in the population and only a subset of the population is measured in a sample survey. The particular sample used in this survey is one of a large number of samples of the same size that could have been selected using the same sample design. Because each unit in the sampling frame had a known probability of being selected into the sample, it was possible to estimate the sampling variability of the survey estimates.
Common measures of the variability among these estimates are the sampling variance, the standard error, and the coefficient of variation (CV), which is also referred to as the relative standard error (RSE). The sampling variance is defined as the squared difference, averaged over all possible samples of the same size and design, between the estimator and its average value. The standard error is the square root of the sampling variance. The CV expresses the standard error as a percentage of the estimate to which it refers. For example, an estimate of 200 units that has an estimated standard error of 10 units has an estimated CV of 5 percent. The sampling variance, standard error, and CV of an estimate can be estimated from the selected sample because the sample was selected using probability sampling. Note that measures of sampling variability, such as the standard error and CV, are estimated from the sample and are also subject to sampling variability. It is also important to note that the standard error and CV only measure sampling variability. They do not measure any systematic biases in the estimates.
The Census Bureau recommends that individuals using these estimates incorporate sampling error information into their analyses, as this could affect the conclusions drawn from the estimates.
Estimates of basic data items (such as receipts, sales, payroll, employment, inventories, etc.) included in the 2022 Economic Census publications are computed from all in-scope establishments in the country and therefore are not subject to sampling error. For those establishments that were not sampled or did not respond, missing data items were either imputed or filled in with administrative data from other government agencies.
Many estimates that are subject to sampling error are provided with an estimate of that error, given in terms of a CV or a standard error. In general, estimates with units (dollars, number of establishments, number of employees, etc.) have sampling errors given with a CV, and estimates of ratios or percentages have sampling errors given with a standard error. Below is a list of sample-based estimates that do not have associated estimates of sampling error provided.
Sample-based estimates with no associated measurement of sampling error (by table):
EC2223BASIC:
- CSLDL (Value of construction work on state and locally owned projects)
- FEDDL (Value of construction work on federally owned projects)
- PRIDL (Value of construction work on privately owned projects)
- RCPCCNDL (Value of construction work subcontracted in from others)
- RCPCWRK (Value of construction work)
- RCPGDL (Value of construction work on government owned projects)
- RCPNCW (Net value of construction work)
- RCPOTH (Value of other business done)
Nonsampling error
Nonsampling error encompasses all factors other than sampling error that contribute to the total error associated with an estimate. This error may also be present in censuses and other nonsurvey programs. Nonsampling error arises from many sources, such as:
- inability to identify and obtain information on all units in the sample,
- response errors,
- differences in the interpretation of the questions,
- mismatches between sampling units and reporting units, requested data and the data available or accessible in the respondents’ records, or confusion about the period for which data is requested,
- mistakes in coding or keying the data obtained, and
- other errors of collection, response, coverage, and processing.
It is important to have metrics to measure, monitor, and manage data collection and the level of response achieved by the data collection methods so that the amount of nonresponse is minimized to the extent possible. One type of response metric is the check-in rate. The check-in rate is calculated as the ratio of the number of reporting units returning a questionnaire to the number of reporting units mailed a request to complete a questionnaire. The check-in rate (expressed as a percentage) for the 2022 Economic Census was over 73%.
A returned questionnaire includes receipt of an electronic submission authorized by the respondent, receipt of an acceptable response during telephone follow-up, or, under special circumstances, respondent-authorized submission by some other means.
Although no other direct measurement of nonsampling error was obtained, precautionary steps were taken in all phases of the collection, processing, and tabulation of the data in an effort to minimize its influence. Precise estimation of the magnitude of the nonsampling errors would require special experiments or access to independent data and, consequently, the magnitudes are often unavailable.
The Census Bureau recommends that individuals using these estimates factor in this information when assessing their analyses of these data, as nonsampling error could affect the conclusions drawn from the estimates.
Response metrics
For the 2022 Economic Census, the Census Bureau produced response metrics in accordance with Census Bureau standard response rate calculations, in order to monitor data collection and to provide additional indicators of data quality. These are the Unit Response Rate (URR), the Total Quantity Response Rate (TQRR), the Quantity Response Rate (QRR), the Administrative Data Rate (ADR), and the Imputation Rate (IR). For definitions, see the Census Bureau Statistical Quality Standards, Appendix D3-B: Requirements for Calculating and Reporting Response Rates: Economic Surveys and Censuses, at https://www.census.gov/about/policies/quality/standards/appendixd3b.html.
To produce these rates, the Census Bureau implemented a detailed method for documenting the sources of data used for correcting estimated or inconsistent data. These correction sources align with those used in the Census Bureau’s annual economic surveys, and are defined as follows:
- corrections obtained directly from respondents;
- data from administrative sources;
- data from other survey(s) with the same reference period;
- data from another reliable secondary source for the same reference period; or
- estimates by industry analysts based on, for example, prior year data or industry averages.
When calculating the standard response metrics, the first four types of corrections are treated in the same manner as “reported” data. For the fifth type of correction, the data are treated as imputed. Imputation rates are indicated with tabulated 2022 Economic Census data using a coding scheme as follows:
0: Imputation rate is less than 10%
1: Imputation rate is greater than or equal to 10% but less than 20%
2: Imputation rate is greater than or equal to 20% but less than 30%
3: Imputation rate is greater than or equal to 30% but less than 40%
4: Imputation rate is greater than or equal to 40% but less than 50%
5: Imputation rate is greater than or equal to 50% but less than 60%
6: Imputation rate is greater than or equal to 60% but less than 70%
7: Imputation rate is greater than or equal to 70% but less than 80%
8: Imputation rate is greater than or equal to 80% but less than 90%
9: Imputation rate is greater than or equal to 90%
The URR for the 2022 Economic Census was just over 60%.
Qualitative research, utilizing techniques such as cognitive interviews or usability testing methods, may be undertaken to assess the performance of new or substantially changed survey questions or data collection instruments, and results are usually used to aid design decisions in order to reduce measurement error and response burden. Post-collection debriefing interviews may be conducted with respondents in order to evaluate the performance of questions/instruments, to identify error sources, and to recommend modifications for future collections. If available, paradata may also be examined to identify problematic questions or instrument designs for further improvement. Reports of findings and recommendations are prepared from these studies and provided to survey managers and sponsors and may be publicly available pursuant to confidentiality and disclosure requirements.
Disclosure avoidance
Disclosure is the release of data that reveals information or permits deduction of information about a particular establishment or company through the release of either tables or microdata. Disclosure avoidance is the process used to protect each survey unit’s identity and data from disclosure. Using disclosure avoidance procedures, the Census Bureau modifies or removes the characteristics that put information at risk of disclosure.
Cell suppression is a disclosure avoidance technique that protects the confidentiality of individual survey units by withholding the values of certain cells within a table from release and replacing the cell value with a symbol, usually a “D”. If the suppressed cell value were known, it would allow one to estimate an individual survey unit’s data too closely.
The cells that must be protected are called primary suppressions. To make sure the cell values of the primary suppressions cannot be closely estimated by using other published cell values, additional cells may also be suppressed. These additional suppressed cells are called complementary suppressions.
The process of suppression does not change the higher-level totals. Values for cells that are not suppressed remain unchanged. Before the Census Bureau releases data, computer programs and analysts ensure primary and complementary suppressions have been correctly applied.
In addition to cell suppression, data rows with fewer than three contributing firms or three contributing establishments are not presented.
Rounding, either from the way data is collected or published, may affect whether a small number is considered a primary suppression. Ranges are sometimes used in place of “D”s to suppress sensitive data, but still provide some meaningful information.
Background on cell suppression, cell sensitivity and the protection of statistical data can be obtained from the Federal Committee on Statistical Methodology's Working Paper 22 (Harris-Kojetin et al, 2005).
The Census Bureau has reviewed the 2022 Economic Census data products to ensure appropriate access, use, and disclosure avoidance protection of the confidential source data (Project No. 7504609, Disclosure Review Board (DRB) approval number: CBDRB-FY23-099).
For more information on the history of the Economic Census, see the following page from the Census Bureau’s history site: https://www.census.gov/about/history/historical-censuses-and-surveys/census-programs-surveys/economic-census.html
For more information on new content for the 2022 Economic Census and changes from the 2017 Economic Census, see the following page: https://www.census.gov/programs-surveys/economic-census/year/2022/news-updates/whats-new.html.
Harris-Kojetin, B.A., Alvey, W.L., Carson, L., Cohen, S.B. and others. (2005). Report on Statistical Disclosure Limitation Methodology. Statistical Policy Working Paper no. 22, Federal Committee on Statistical Methodology.
https://www.fcsm.gov/assets/files/docs/spwp22WithFrontNote.pdf
Page Last Revised - February 12, 2025
✕
Is this page helpful?
 Yes
Yes
 No
No
 Yes
Yes
 No
No✕
NO THANKS
255 characters maximum
 255 characters maximum reached
✕
Thank you for your feedback.
Comments or suggestions?

Comments or suggestions?