
Official websites use .gov
A .gov website belongs to an official government organization in the United States.
Secure .gov websites use HTTPS
A lock (
) or https:// means you’ve safely connected to the .gov website. Share sensitive information only on official, secure websites.

Topics
Data & Maps
Surveys & Programs
Resource Library
2017 Economic Census Methodology
2017 Economic Census Methodology
In This Section:
Survey Design
Target Population
The target population of the Economic Census consists of all establishments that:
- Are in operation for at least some part of 2017
- Are located in one of the 50 states, associated offshore areas, or the District of Columbia.
- Have paid employees
- Classified in one of eighteen in-scope sectors defined by the North American Industry Classification System (NAICS).
The 2017 Economic Census covers the following NAICS sectors of the U.S. economy:
- 21 – Mining, Quarrying, and Oil and Gas Extraction
- 22 – Utilities
- 23 – Construction
- 31-33 – Manufacturing
- 42 – Wholesale Trade
- 44-45 – Retail Trade
- 48-49 – Transportation and Warehousing
- 51 – Information
- 52 – Finance and Insurance
- 53 – Real Estate and Rental and Leasing
- 54 – Professional, Scientific and Technical Services
- 55 – Management of Companies and Enterprises
- 56 – Administrative and Support and Waste Management and Remediation Services
- 61 – Educational Services
- 62 – Health Care and Social Assistance
- 71 – Arts, Entertainment, and Recreation
- 72 – Accommodation and Food Services
- 81 – Other Services (Except Public Administration)
More detailed descriptions of these sectors can be found at the Census Bureau NAICS webpage, www.census.gov/eos/www/naics/.
The following industries (NAICS) are not covered by the 2017 Economic Census:
- 11 – Agriculture, Forestry, Fishing and Hunting
- 482 – Rail Transportation
- 491 – Postal Service
- 525 – Funds, Trusts, and Other Financial Vehicles
- 6111 – Elementary and Secondary Schools
- 6112 – Junior Colleges
- 6113 – Colleges, Universities, and Professional Schools
- 8131 – Religious Organizations
- 81393 – Labor Unions and Similar Labor Organizations
- 81394 – Political Organizations
- 814 – Private Households
- 92 – Public Administration
Sampling frame
The Economic Census selects establishments for its sample from a frame obtained from the U.S. Census Bureau’s Business Register. The Business Register contains information on the physical location of establishments, as well as payroll, employment, receipts (value of shipments), and industry classification data obtained from prior censuses and surveys or obtained from the administrative records of the Internal Revenue Service (IRS) and Social Security Administration (SSA) under special arrangements which safeguard the confidentiality of both tax and census records. Information from the Bureau of Labor Statistics on industry classifications are also used to supplement the classification information from the IRS and SSA.
To improve the quality of the frame, in 2016, the Census Bureau conducted a classification survey to update the NAICS industry classification of those establishments on the Business Register that could not be adequately classified into a NAICS industry code.
To be included on the sampling frame, an establishment was required to satisfy the following conditions:
- It must be classified into an in-scope NAICS industry;
- It must be an active establishment of a multi-establishment firm, or it must be a single-establishment firm with at least one quarter of 2017 administrative payroll; and
- It must be located in one of the 50 states, associated offshore areas, or the District of Columbia.
Sample Design
The sample component of the 2017 Economic Census consists of four parts:
- All active operating establishments of multi-establishment firms (“Multi-Estab”),
- All single-establishment firms whose annualized payroll was above an industry-specific payroll cutoff (“Large Certainty”),
- Certain single-establishment firms taken with certainty for some specific reason (“Special Certainty”), or
- A stratified sample selected from the remaining, generally smaller, single-establishment firms (“Non-Certainty”).
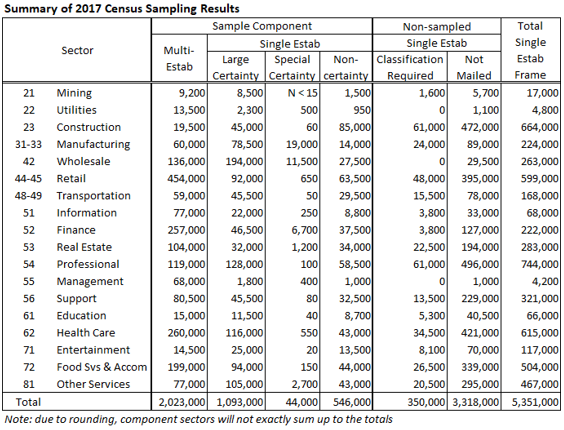
In order to reduce respondent burden and costs, the Census Bureau did not require all establishments to make a Census report. For tabulations of basic data items (sales, payroll, employment, etc.) we use the administrative data of these, generally smaller, single establishment firms. This non-sampled component consists of:
- Small single-establishment firms on the sampling frame but not selected into the Census sample. However, some of these establishments received an Economic Census request for industry classification information so that their administrative data could be accurately tabulated in the correct industry. The column, “Classification Reqd” in the table below indicates the number of single-establishment firms that were required to provide this classification information. The remaining single establishment firms were not contacted for the Economic Census (“Not Mailed” in the table below).
- Single-establishment firms with no classification information. There were approximately 20,000 of these firms and while they were not included in the sample, they were asked to provide industry classification information only.
- Any single-establishment firms that started business operations so late in 2017 (mostly in the 4th quarter) that their 2017 administrative payroll was not received by the Census Bureau until after the 2017 sample was selected – roughly 260,000 firms.
As mentioned above, for the non-sampled component, the Economic Census uses imputation and administrative data from other federal agencies in lieu of requiring a response from these single-establishment firms.
The table below shows the sizes of each of the sample components and the first non-sampled component. The last column shows the total number of single establishment firms that were on the sampling frame.
Selection procedures differ between multi- and single-establishment firms.
Multi-Establishment Firms
Any firm with more than one active establishment is included in the Economic Census with certainty and is generally expected to report for all of its establishments. Each establishment is included with certainty and assigned a sample weight of 1.
Establishment Reporting Units
In most industries, multi-establishment firms are required to complete an industry-specific questionnaire for each of the establishments in their firm.
Alternative Reporting Units (ARU) for Selected Industries
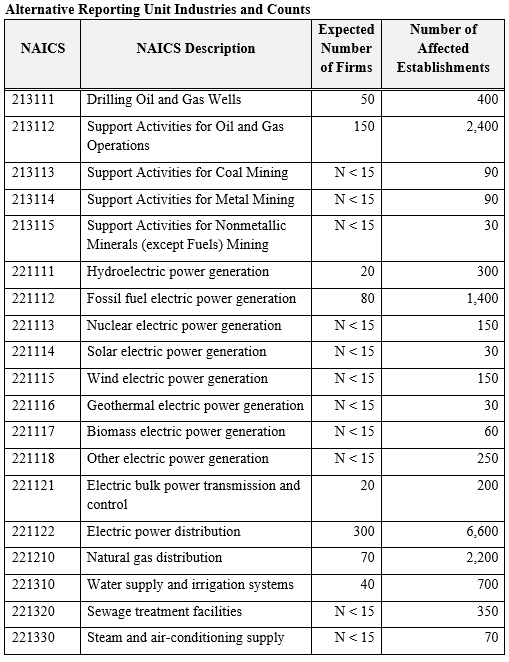
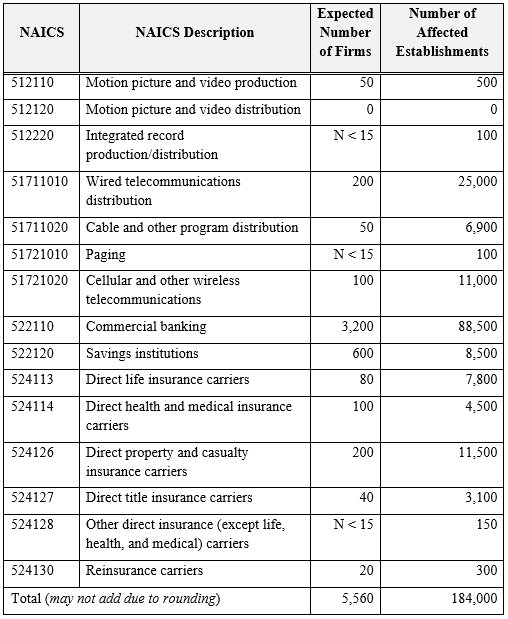
In some industries, firms have difficulty reporting revenue and related data for each of their business locations (establishments). However, they can provide firm-level industry totals with relative ease and they can report separate payroll and employment information for each business location within the industry. The table below shows the industries for which an alternative questionnaire was used and the expected number of affected firms.
If a firm had more than two establishments in an industry listed below, the firm received one questionnaire for each of those industries. Each questionnaire requested consolidated, firm-level data for revenue and related measures covering the firm’s nationwide operations. A supplementary questionnaire enumerated the firm’s establishments in the industry and requested payroll and employment information for each of them.
Single Establishment Firms with 2017 Payroll
The sample design for single-establishment firms began with a study of the potential respondent universe. This study produced a set of industry-specific payroll cutoffs that were used to distinguish large single-establishment firms from small ones within each industry. In general, these cutoffs were chosen so that the sum of the payroll of the multi-establishment firms plus the payroll of the single-establishment firms above the cutoff equaled 75-95% of the total payroll in an industry, though there were exceptions. In the hypothetical example below, a payroll cutoff of $229,000 for an industry will result in 80% of total industry payroll (32.6% + 47.4%) being contained within the 6,655 establishments (2,508 + 4,147) selected with certainty.
Hypothetical Example of Certainty Payroll Cutoff
Establishment Type |
Number of Establishments |
Payroll ($000) |
% of Total Payroll |
Establishments of Multi-Establishment Firms |
2,508 |
1,475,097 |
32.6% |
Single-establishment firms with payroll ≥ $229,000 |
4,147 |
2,144,773 |
47.4% |
Remaining “small” single-establishment firms |
17,934 |
904,968 |
20.0% |
Totals |
24,589 |
4,524,838 |
100.0% |
The single-establishment firm sample selection had three phases: identifying the “large” single-establishment firms including some firms with special characteristics, selecting a sample of the “small” single-establishment firms, and determining if additional classification information was needed from the non-selected single-establishment firms.
Identifying “Large” Single-Establishment Firms
All single-establishment firms with annualized administrative payroll that equaled or exceeded the certainty payroll cutoff for their industry were included in the sample component of the Economic Census with certainty. Each had a probability of selection of 1, and a sample weight of 1, which applies only for producing industry-specific statistics where data are not available from administrative records. Note that “Large” is relative. In some industries, this payroll cutoff was zero and all establishments were selected into the sample.
In addition, certain single-establishment firms were included with certainty, regardless of size, based on other characteristics. These included firms that were likely cooperatives and firms included in the Annual Survey of Manufacturers (ASM).
Sampling “Small” Single-Establishment Firms
The remaining single-establishment firms (those with annualized payroll below the cutoff for their industry) were stratified by industry and state and selected using a strata-specific probability of selection.
The probabilities of selection for these strata were determined by a study of the potential respondent universe conducted shortly before sample selection operations began. Selected small single-establishment firms were included in the sample as non-certainty cases. Each had a probability of selection that generally fell within the range of 0.8 to 0.04. In industry by state strata containing fewer than five establishments, all were included in the sample.
Determining Which Establishments Need Classification Information
All remaining (non-sampled) single-establishment firms with payroll were represented in the Economic Census by data from federal administrative records or through imputation and were not usually required to respond. However, in some cases, the industry classification information on the Business Register – used to tabulate the (quantitative) administrative data in the correct industry – is inadequate or outdated. The most common reasons for a deficient classification were administrative classification data provided to the Census Bureau lacking sufficient detail to assign an establishment to a publication level NAICS industry or the administrative data were not in agreement regarding an establishment’s classification.
Sample maintenance:
After the initial sample selection in November 2017, a second sample of single establishment companies was selected in March 2018 from those establishments on the Business Register with 2017 payroll that were not on the initial sampling frame. Any single-establishment firms that started business so late in 2017 that their administrative data was not available to the Census Bureau in time for the last sampling operation, were included in the Census using their administrative data.
Data Collection
Data items requested and reference period covered:
The reference period is the year 2017. The materials and information mailed to the establishments selected into the Census are available at https://www.census.gov/programs-surveys/economic-census/information.html. The 2017 Census questionnaires are available at https://bhs.econ.census.gov/ombpdfs/.
Frequency and mode of contact:
The 2017 Economic Census was the first Economic Census collected entirely online. No paper forms were mailed to stateside businesses. Respondents were contacted in May of 2018 with an initial survey letter requesting their participation online. Respondents also received a reminder letter prior to the June 12 due date. Up to four “past due” follow-ups were sent via mail and multiple email follow-ups were sent to companies that had started, but not yet completed, the reporting process online. Select companies also received reminder calls via telephone in late 2018 and early 2019. Initial and follow up letters can be found under respondent materials.
Data collection unit:
For all single-establishment firms and most multi-establishment firms, the data collection unit is the establishment. As mentioned previously in the sample design section above, in certain industries, multi-establishment firms have difficulty reporting revenue and related data for each of their establishments. These firms received a special questionnaire that requested consolidated, firm-level data for revenue and related measures. A supplementary questionnaire listed the firm’s establishments in the industry and requested payroll and employment information for each of them.
Special procedures:
For the last non-response follow-up mailing, a certified letter was mailed to roughly one-half of the non-respondents (with the other non-respondents received a regular letter). The non-respondents to receive the certified letter were selected using a process that identified industry by state combinations where the response was poorest and selecting a larger proportion of non-respondents from those combinations.
Compilation of Data
Editing
Data captured in an Economic Census must be edited to identify and correct reporting errors. The data also must be adjusted to account for missing items and for businesses that do not respond. Data edits detect and validate data by considering factors such as proper classification for a given record, historical reporting for the record, and industry/geographic ratios and averages.
The first step of the data editing process is classification. To assign a valid kind-of-business or industry classification code to the establishment, computer programs subject the respondents’ responses to pre-specified items of a series of data edit programs. The specific items used for classification depend on the census report forms and include:
- Self-designated kind-of-business check-box classifications,
- Responses to product lines sold by a retail establishment,
- Products manufactured by a plant, and
- Entries written in by the respondent explaining the establishment’s activities.
If critical information is missing, the record is flagged and fixed by analysts before further processing occurs.
If all critical information is available, the classification code is assigned automatically. After classification codes are assigned, a "verification" operation is performed to validate the industry, geography and ZIP Codes.
After an establishment has been assigned a valid industry code, the data edits further evaluate the response data for consistency and validity—for example, assuring that employment data are consistent with payroll or sales/receipts data. Response data is always evaluated by industry; in some cases, type of operation or tax-exempt status is also taken into account. Additional checks compare current year data to data reported in previous censuses or from administrative sources.
Nonresponse:
Nonresponse is defined as the inability to obtain requested data from an eligible survey unit. Two types of nonresponse are often distinguished. Unit nonresponse is the inability to obtain any of the substantive measurements about a unit. In most cases of unit nonresponse, the Census Bureau was unable to obtain any information from the survey unit after several attempts to elicit a response. Item nonresponse occurs either when a question is unanswered or the reported data is unusable.
Nonresponse adjustment and imputation:
Nonresponse is handled by estimating or imputing missing data. Imputation is defined as the replacement of a missing or incorrectly reported item with another value derived from logical edits or statistical procedures.
The primary methods for imputing missing basic data items (such as receipts, sales, payroll, and employment) are:
- Using administrative data
- Deriving the missing data item from the establishment’s other data (either reported or administrative)
- Deriving the missing data item using 2012 Census data
- Obtaining the information from another 2017 survey
Some data items on certain subject series tables use expansion, rather than imputation, to account for nonresponse. For example, missing data are not imputed for the employment by function variables. Consider the following example from NAICS = 423, “Type of operation” = 10:
NAICS code |
Type of Operation Code |
Employment by function code |
Meaning of Employment by function code |
Number of paid employees |
423 |
10 |
001 |
Total |
E1 |
423 |
10 |
630 |
Selling |
E2 |
423 |
10 |
631 |
Sales support |
E3 |
423 |
10 |
632 |
Central administrative and general support |
E4 |
423 |
10 |
633 |
Packaging |
E5 |
423 |
10 |
634 |
Production |
E6 |
423 |
10 |
635 |
Knockdown assembly |
E7 |
423 |
10 |
636 |
Other |
E8 |
The estimate in cell E1 is the sum of the estimates in cells E2-E8. This estimate in cell E1 should also equal the number of paid employees for the corresponding NAICS by Type of operation found on the Geographic Area Series table. However, after estimation and before expansion, nonresponse in cells E2-E8 has not been accounted for, and thus E1 can only equal the corresponding total on the Geographic Area Series table in the case of perfect response. To account for any nonresponse, an expansion factor is calculated for every NAICS by Type of operation cell. (This expansion factor will also account for any discrepancy between the weighted total employment and the full tabulation of total employees.)

Each of the “Number of paid employees” values within a given NAICS by Type of operation cell is then multiplied by this value, resulting in an E1 value that equals the corresponding value on the Geographic Area Series table, and E2 through E8 values which still sum to the total E1. The coverage, a measure of the proportion of the total that is reported, has the following relationship to the expansion factor:
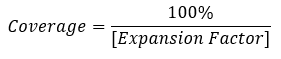
Many of the other miscellaneous subject series tables also use an expansion factor to account to account for nonresponse for one or more data item. Just as the expansion factor discussed above uses the total number of paid employees from the Geographic Area Series in its calculation, the other expanded miscellaneous subject series items use a Geographic Area Series total, such as total receipts or total annual payroll to calculate their respective expansion factors.
Sampled establishments that did not report NAPCS product data are assigned products and product receipts using a hot-deck imputation (HDI) process, as described below, where receipts is defined as sales, value of shipments, or revenue. In this process, the products (and their associated relative contribution to the establishment’s total receipts) from a similar establishment (called the donor) are assigned to the establishment missing the product data (the recipient).
In preparation for the 2017 change to the NAPCS-based collection codes, the HDI process described in this section was chosen as the single imputation method to treat missing product data collected from all sectors. Previously, the strategy of correcting for nonresponse varied by sector within the Economic Census. Since NAPCS allows for cross-sector tabulation of products, standardizing the imputation method across the Economic Census was desirable.
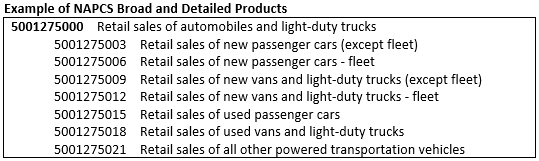
The NAPCS-based collection codes have two levels: a broad or general product and then more detailed products within the broad product. Below is an example of one broad product (5001275000) and its seven detailed products. Not all broad products have detailed products and detailed products are usually only required in industries where the product is likely to be sold.
NAPCS Recipients and Donors
Recipients come from two sources:
- Complete non-respondents, and
- Partial respondents who fail to provide usable NAPCS product data.
Most respondents are classified as:
- Complete donors – who report a receipts dollar amount for every reported (and required) product.
- Partial donors – who report a valid set of broad products but are missing some or all of the detailed products that should have been reported.
- In certain cases, some responses – even though they contain valid product data – are considered unique so they are not used as donors (though their data are included in the product estimates). These establishments are called “Non-donors.”
The table below shows the number of establishments classified into each of the categories.
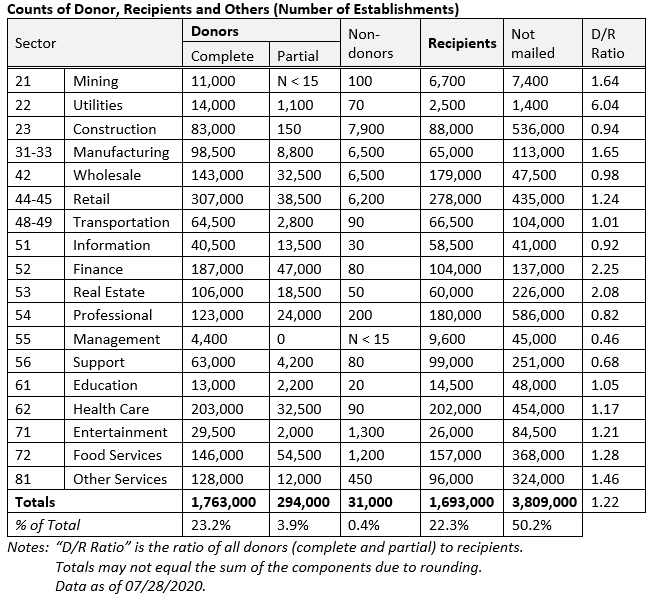
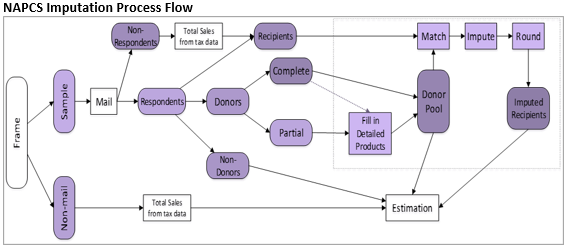
In the first stage of the HDI process, the missing detailed products of the partial donors are filled in using the distribution of those reported detailed products that passed the edits, for each broad product (from the complete donors and partial donors with detailed products). Once this is finished, all donors are essentially “complete” and are assembled in the donor pool. Depending on the industry, the donors and recipients are then matched within an imputation cell (see “Imputation Cell Definition” table, below) and a donor establishment chosen for each recipient either randomly or based on similarity of each establishment’s total receipts (nearest neighbor). The donor’s product list and product distribution (percentage of total receipts in each product) are assigned to the recipient and dollar amounts imputed (and rounded to integers) using this distribution and the recipient’s total receipts. The figure below illustrates this process.
If a partial donor has no available donors from which to receive a distribution of detailed products, a fallback category average method is used to impute its detailed products. “Category averages” are the distributions of detail products per ‘NAICS by broad product combination’. (For example, ‘NAICS 44111000 by broad product 4001235000’ may have a detail product distribution as follows: 4001235003 (12.1%) + 4001235006 (23.8%) + 4001235009 (64.1%)). Subject matter experts use the NAPCS structure as the basis to develop these category average parameters.
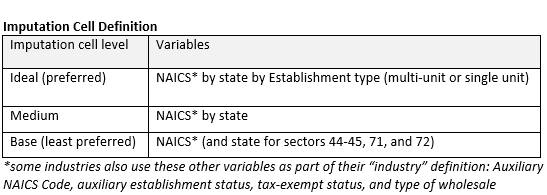
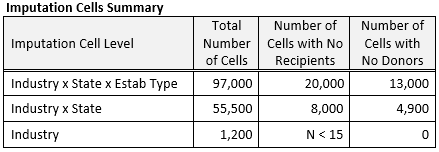
Imputation cells are initially defined by NAICS industry x State x Establishment Type (where establishment type is either establishments of multi-establishment firms or single-establishment firms). If, for a particular recipient, there are no matching donors in this cell, then the Establishment Type requirement is dropped and a donor sought within the same industry and state as the recipient. If there is still no matching donor, then a donor in the same industry is used. The table below summarizes the number of imputation cells at each of these three levels along with the number of cells with zero or one donor. See Imputation Cell Definition table above for summary of imputation cell levels.
For each recipient establishment, the HDI process chooses a donor establishment from within the recipient’s imputation cell and assigns the donor’s product distribution to the recipient. A study was done to determine whether the HDI process chooses the donor at random or chooses the donor according to a proximity algorithm (which is also known as nearest neighbor HDI) (Bechtel et al, 2015). For each imputation cell, there is no required minimum number of donors; no required donor-to-recipient ratio; and, no limit on the number of times a donor was used. In the event that any industry-level cell containing recipients has no donors, subject matter experts developed a fallback parameter file of product distributions, based on the NAPCS structure and industry knowledge, to assign product distributions to such recipients.
Other macro-level adjustments:
NAPCS Product Expansion
For the NAPCS product estimates, a post-stratification weighting adjustment (using industry by state strata) is subsequently performed to ensure that the weighted product data of the sampled establishments sum to the total receipts of all establishments.
After the HDI process, all sampled establishments will have been assigned valid NAPCS products so that for each establishment:
- the sum of the broad product receipts will equal the establishment’s total receipts, and
- the sum of the detailed product receipts will equal the receipts of the corresponding broad products
Though the sample is designed to represent the frame from which it is selected, the weighted receipts of the sample will not exactly match the total receipts of all (sampled and non-sampled/non- mailed) establishments for various reasons.
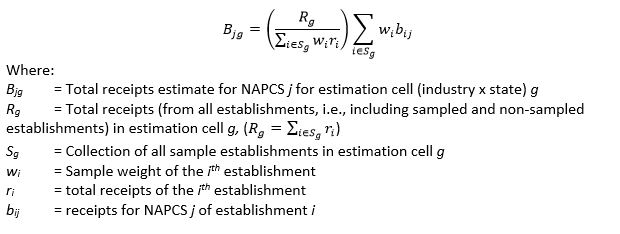
Because the NAPCS product receipts of each individual establishment sum to that establishment’s total receipts, the sum of the weighted broad product receipts will sum to weighted total receipts of the sample establishments. In order to make the NAPCS receipts estimates sum to the total receipts of all establishments, it is necessary to make a weighting (expansion) adjustment. The formula for this adjustment is:
Estimation:
Economic Census tabulations for basic statistics (receipts, payroll, employment, etc.) are simple summations of data from all in-scope establishments using reported data collected from the Economic Census, plus administrative records data or imputed data for non-respondents and single-unit establishments that were not selected into the Economic Census sample. The most common source of imputed data is administrative data from the IRS. For multi-establishment firms in alternative reporting industries (see the sample design section above), the consolidated firm level receipts data is first allocated to the individual establishments of the firm in the industry.
Economic Census estimates for industry-specific statistics, such as NAPCS product revenue and other industry-specific special inquiries, are derived by summing weighted data, where each certainty establishment (establishments of multi-establishment firms and “large” single-establishment firms) has a weight of 1, and each non-certainty establishment has the sample weight assigned during the sample selection process (see above). These initial weighted estimates are further adjusted to ensure that these detailed estimates sum to the basic statistics total as described above. For example, the sales of products within an industry (estimated from the sample) should sum to the total industry receipts (computed from all establishments).
Dollar values are published in current dollars. In tables that compare the current Census to prior Census, no adjustment has been made to the estimates to account for inflation during the intervening period.
Sampling Error:
The sampling error of an estimate based on a sample survey is the difference between the estimate and the result that would be obtained from a complete census conducted under the same survey conditions. This error occurs because characteristics differ among sampling units in the population and only a subset of the population is measured in a sample survey. The particular sample used in this survey is one of a large number of samples of the same size that could have been selected using the same sample design. Because each unit in the sampling frame had a known probability of being selected into the sample, it was possible to estimate the sampling variability of the survey estimates.
Common measures of the variability among these estimates are the sampling variance, the standard error, and the coefficient of variation (CV), which is also referred to as the relative standard error (RSE). The sampling variance is defined as the squared difference, averaged over all possible samples of the same size and design, between the estimator and its average value. The standard error is the square root of the sampling variance. The CV expresses the standard error as a percentage of the estimate to which it refers. For example, an estimate of 200 units that has an estimated standard error of 10 units has an estimated CV of 5 percent. The sampling variance, standard error, and CV of an estimate can be estimated from the selected sample because the sample was selected using probability sampling. Note that measures of sampling variability, such as the standard error and CV, are estimated from the sample and are also subject to sampling variability. It is also important to note that the standard error and CV only measure sampling variability. They do not measure any systematic biases in the estimates.
The Census Bureau recommends that individuals using these estimates incorporate sampling error information into their analyses, as this could affect the conclusions drawn from the estimates.
Estimates of basic data items, such as receipts, sales, payroll, employment, inventories, etc. included in the 2017 Economic Census First Look and Geographic Area Series publications are computed from all in-scope establishments in the country and therefore are not subject to sampling error. For those establishments that were not sampled or did not respond, missing data items were either imputed or filled in with administrative data from other government agencies.
NAPCS Variance Estimation
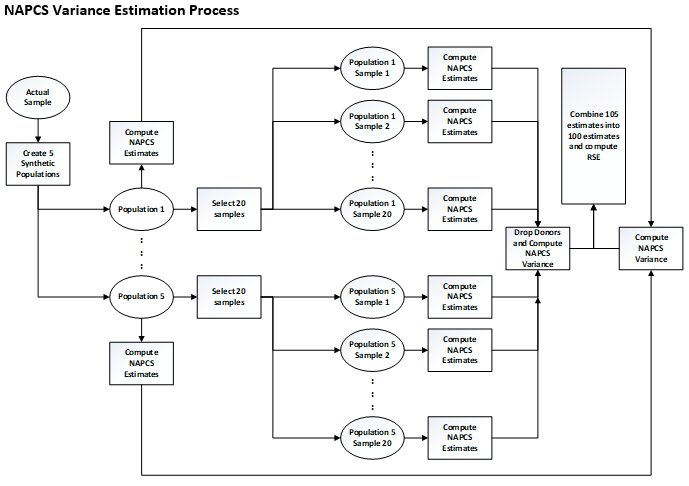
NAPCS variance estimation was accomplished by (see “NAPCS Variance Estimation Process” figure, below):
- Creating five synthetic populations from the original Economic Census sample using the Finite Population Bayesian Bootstrap (FPBB) method.
- Selecting twenty samples from each of these five populations using the Approximate Bayesian Bootstrap (ABB) method.
- Sending each of these 100 samples – each of which has a different set of donors and recipients –through the entire NAPCS HDI process to impute NAPCS to each sample’s recipients, plus 5 HDI runs for the FPBB donor sets.
- Using these (now imputed) samples to compute 100 sets of NAPCS estimates.
- Computing, from this set of 100 NAPCS product estimates, an estimate of the variance of each NAPCS estimate. This is a combination of sampling variance (derived from the five different populations used) and imputation variance (derived from the twenty different samples per population).
(For more information about the development of this NAPCS variance estimation process, see Knutson et al, 2017.)
NAPCS Variance Estimation Step 1: Finite Population Bayesian Bootstrap (FPBB)
The first step of NAPCS Variance Estimation is to create five synthetic populations from the original Census sample using the Finite Population Bayesian Bootstrap (FPBB) method.
The Finite Population Bayesian Bootstrap (Zhou et al, 2012) is a non-parametric multiple imputation method that accounts for complex sampling procedures and post-stratification. With the FPBB, the idea is to expand the sample of size 𝑛 into several FPBB synthetic populations, each of size 𝑁, where 𝑁 is the original population size. These FPBB synthetic populations are created by drawing (Nh - nh) units from stratum ℎ from the original sample with probability for the 𝑘th selection,
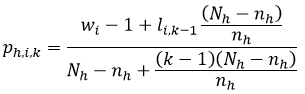
where wi is the post-stratified sampling weight of unit i, li,k-1 is the number of times unit 𝑖 has been selected up to the (𝑘−1)th selection, and k is the number of selections that have been made.
The (Nh - nh) resampled units are added to the original sample to complete the FPBB synthetic population. As described by Zhou et al (2012), this is an application of a Pólya sample designed to “restore the existing complex survey sample back to some SRS-type/self-weighting data structure.” This process, which Zhou refers to as “uncomplexing” the sample, is repeated several times to create five synthetic populations.
The figure “Creating three synthetic-populations from a sample by FPBB”, below, gives an example of the FPBB process creating three synthetic populations for an unequal probability sample of size n = 6, sampled from a population of size N = 11. A value of “?” indicates a nonrespondent in the sample that is likewise included as a nonrespondent in the expanded synthetic population.
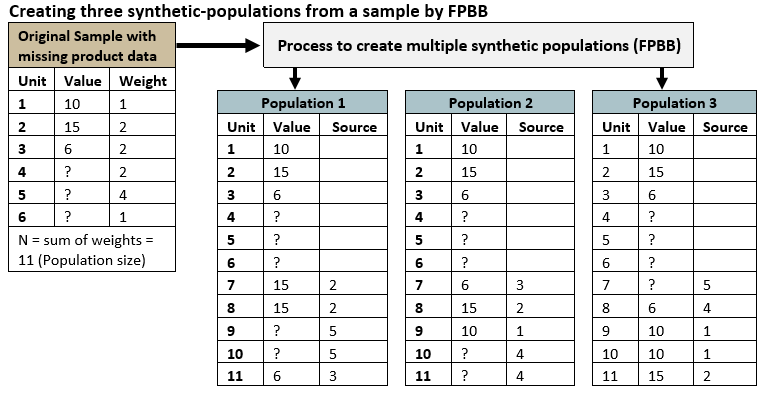
Note that a post-stratified sampling weight is used instead of the design weight in the Pólya sampling procedure, and thus the expanded population sizes may differ from the original sampling frame population sizes. This adjustment of the sampling weight is done so that the sum of the post-stratified sample weights sum to an integer - which is required for the FPBB process.
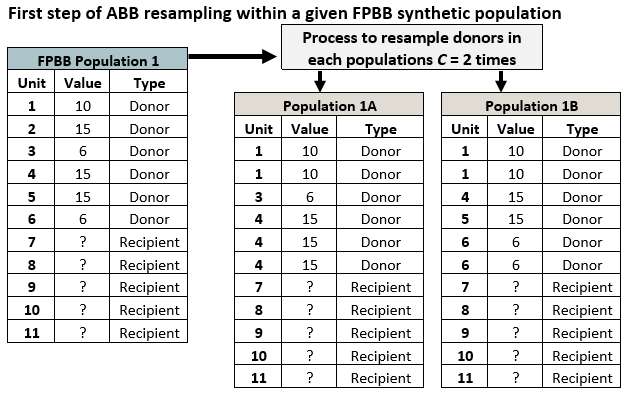
NAPCS Variance Estimation Step 2: Approximate Bayesian Bootstrap (ABB)
The next step is to incorporate product nonresponse and estimate the nonresponse variance. To do this, we employ the Approximate Bayesian Bootstrap (ABB) within each FPBB synthetic population. The ABB is a straightforward way to implement multiple imputation for the HDI methodology. Rubin and Schenker (1986) and Rubin (1987) propose the ABB as a tool for introducing appropriate variability into a multiple imputation procedure. ABB is a non-Bayesian method that approximates a Bayesian procedure and adjusts for the uncertainty in the distribution parameters resulting in a proper imputation procedure. The figure below illustrates how the ABB draws a simple random sample (SRS) of respondents with replacement. Note that for a given FPBB population the resampled ABB populations have the same set of nonrespondents (recipients) but different sets of respondents (donors).
NAPCS Variance Estimation Step 3: HDI to impute NAPCS
At this stage, there are 100 different samples from the ABB process, each with different set of donors and recipients. We also retained the donors from the 5 FPBB populations for a total of 105 different populations. The next step is to send each population through the entire NAPCS HDI process, imputing values for missing data, using the sample of respondents drawn in the previous step, as the ABB replicate donors (see figure “ Multiple Imputed ABB Replicates for Population 1”, below). The first stage imputes detail product NAPCS from industry averages for population establishments with valid broad products (donors and non-donors) but missing or invalid detail products. The second stage uses the updated donors to impute broad and detail product NAPCS to population recipients.
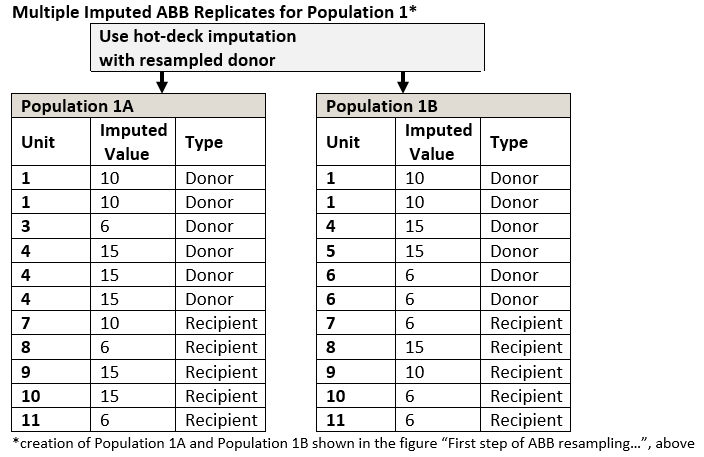
Each round of the ABB procedure results in one complete dataset. This procedure is then repeated 20 times to obtain multiple imputed datasets. Ultimately, each of the five FPBB synthetic populations will have 20 ABB replicates.
After HDI is run, all records with NAPCS receipts equal zero are removed. These records occur when an imputed value is rounded down to zero. This is done, so that these establishments are not counted as having the associated product.
NAPCS Variance Estimation Step 4: Computing the NAPCS estimates:
The next step is to use these 105 (now imputed) samples to compute 100 sets of NAPCS total receipt estimates. In addition, 100 estimates of the number of records in the cell (establishments) are computed. These are mentioned here to note they are processed in the identical fashion to NAPCS receipts.
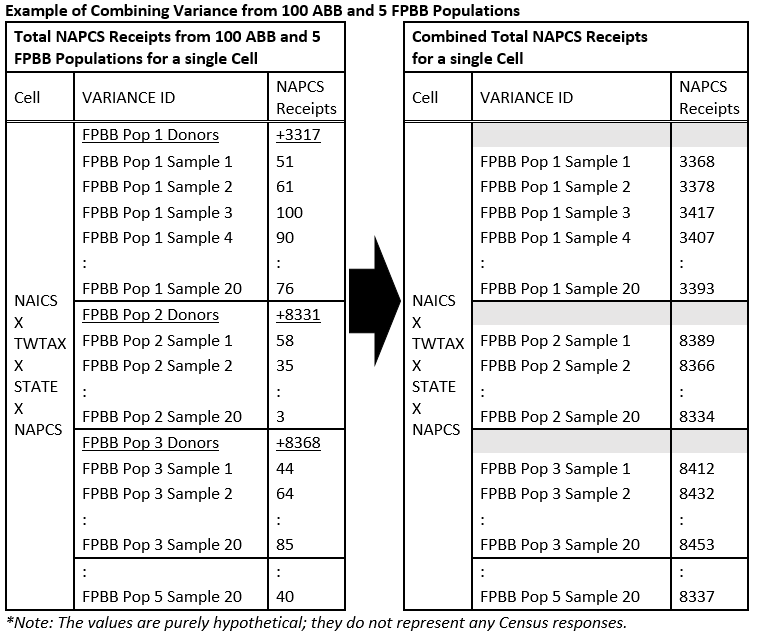
Totals are computed for each “NAICS x Tax Exempt Status/Type of Wholesale Operation x State x NAPCS code” cell. (NAICNEW x TWTAX x STATE x NAPCS in the figure “Example of Combining Variance…” below). The column “Variance ID” indicates which population the record is from.
For the 100 runs from the ABB populations (20 samples x 5 FPBB), donor records are dropped before tabulation. While these were run earlier through HDI to determine non-donor and recipient variance, a better estimate of donor variance comes from the FPBB populations.
NAPCS receipts estimates are combined to produce a new set of estimates. A donor estimate (underlined in the figure “Example of Combining Variance…”, below) is added to each associated recipient estimate. The 105 sets of estimates became 100 sets of estimates. The figure below shows an example of how this works for a single cell.
Note: It is possible that there may be cells among the donors that do not exist in one or more sets of recipient estimates (and vice versa).
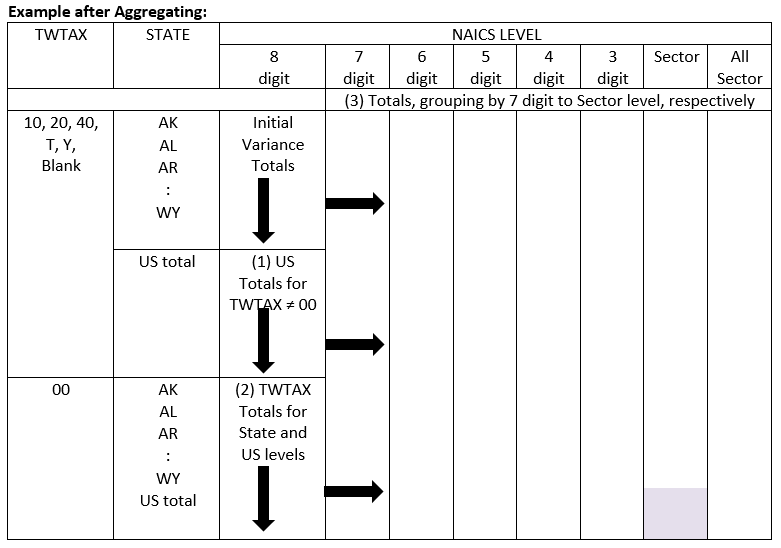
These NAPCS receipts estimates are augmented with aggregates for the US, other NAICS code levels, and Type of Wholesale/Tax Exempt Status total as follows
1. Computing US level aggregates
For every VARIANCE ID x NAICS x Type of Wholesale Operation/Tax Exempt Status x NAPCS combination 51 state-level NAPCS receipts estimates are summed to produce the estimates for the US total.
2. Computing Type of Wholesale Operation/Tax Exempt Status aggregates
For every VARIANCE ID x NAICS x STATE x NAPCS combination NAPCS receipts estimates are summed for the two values of Type of Wholesale Operation/Tax Exempt Status (TWTAX in the table) within the cell (including ’00’). This new sum is set to ’00’ (two zeros) in the table “Example after Aggregating”, below.
3. Computing other NAICS level estimates
For every VARIANCE ID x Type of Wholesale Operation/Tax Exempt Status x STATE x NAPCS combination, compute the NAPCS receipts estimates for all other NAICS levels: 7, 6, 5, 4, 3-digit, sector, and then all-sectors (NAICS=000000), by summing the detailed (8-digit) estimates that make up the aggregated NAICS level.
Once completed, every NAPCS product has 100 sets of estimates. Each set contains estimates at the state and US levels, for all NAICNEW levels, 8-digit through all-sectors, and for each value of Type of Wholesale Operation/Tax Exempt Status (including the aggregate) as illustrated below in the table “Example after Aggregating”.
NAPCS Variance Estimation Step 5: Computing NAPCS Variance
The variance for each NAICS x Type of Wholesale Operation/Tax Exempt Status x STATE x NAPCS is computed using the following formula:
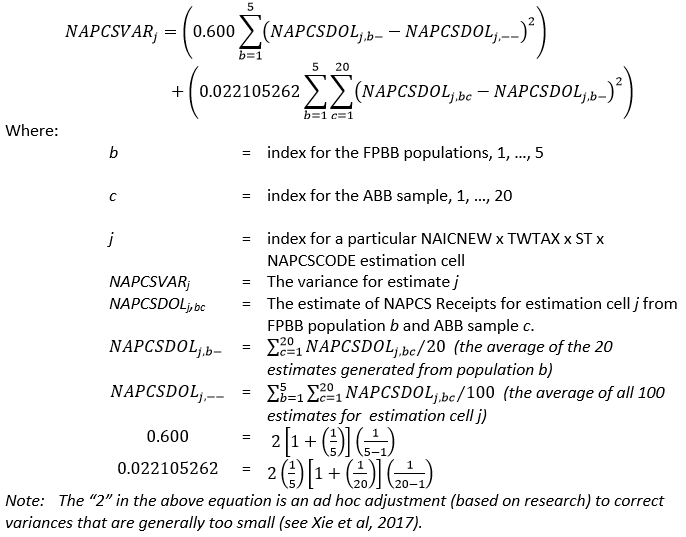
In addition to computing the variance, the number of times a particular estimation cell appears among the 100 replicates is counted. If no estimate exists for one or more values of VARIANCE ID within an estimation cell, the missing estimates are treated as zeros for purposes of computing averages and differences in the formula above.
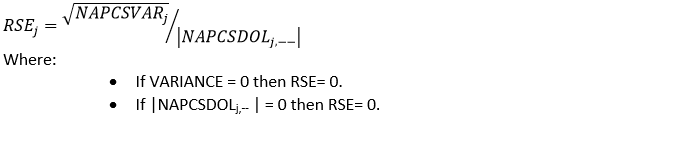
The Relative Standard Error (RSE) is computed for NAPCS totals receipts estimate j using the formula below by dividing the square root of the variance (NAPCSVARj) by the absolute value of the overall average NAPCSDOL estimate (the one computed from all 100 replicates).
Confidence Interval:
The sample estimate and an estimate of its standard error allow us to construct interval estimates with prescribed confidence that the interval includes the average result of all possible samples with the same size and design. To illustrate, if all possible samples were surveyed under essentially the same conditions, and an estimate and its standard error were calculated from each sample, then:
- Approximately 68 percent of the intervals from one standard error below the estimate to one standard error above the estimate would include the average estimate derived from all possible samples.
- Approximately 90 percent of the intervals from 1.645 standard errors below the estimate to 1.645 standard errors above the estimate would include the average estimate derived from all possible samples.
In the example above, the margin of error (MOE) associated with the 90 percent confidence interval is the product of 1.645 and the estimated standard error.
Note that given the variance estimation method described above, ‘all possible samples’ refers to both the original sample design and the replicate samples used for variance estimation. Therefore, the variance estimates and corresponding confidence intervals measure both sampling error and error introduced from the hot-deck imputation process.
For example, if a NAPCS product estimate is $1,000,000, and the RSE is reported as 1%, then the standard error is $10,000, and the 90% confidence interval for the product is $1,000,000 plus or minus $16,450 (the standard error of $10,000 times 1.645), giving limits of $983,550 and $1,016,450.
Nonsampling Error:
Nonsampling error encompasses all factors other than sampling error that contribute to the total error associated with an estimate. This error may also be present in censuses and other nonsurvey programs. Nonsampling error arises from many sources, such as:
- Inability to identify and obtain information on all units in the universe
- Industry misclassification
- Differences in the interpretation of the questions
- Mismatches between sampling units and reporting units, requested data and the data available or accessible in the respondents’ records, or confusion about the period for which data is requested
- Errors in recording, coding, or keying the data obtained, and
- Other errors of collection, response, coverage, processing and estimation for missing or misreported data.
It is important to have metrics to measure, monitor, and manage data collection and the level of response achieved by the data collection methods so that the amount of nonresponse is minimized to the extent possible. One type of response metric is the check-in rate. The check-in rate is calculated as the ratio of the number of reporting units returning a questionnaire to the number of reporting units mailed a request to complete a questionnaire. The check-in rate (expressed as a percentage) for the 2017 Economic Census was just over 75%.
A returned questionnaire includes receipt of an electronic submission authorized by the respondent, receipt of an acceptable response during telephone follow-up, or, under special circumstances, respondent-authorized submission by some other means.
Nonsampling error for NAPCS products due to nonresponse and imputation was measured together with sampling error; coefficients of variation provided for NAPCS products include both sampling error and variability due to the imputation method used.
Although no other direct measurement of nonsampling error was obtained, precautionary steps were taken in all phases of the collection, processing, and tabulation of the data in an effort to minimize its influence. Precise estimation of the magnitude of the nonsampling errors would require special experiments or access to independent data and, consequently, the magnitudes are often unavailable.
The Census Bureau recommends that individuals using these estimates factor in this information when assessing their analyses of these data, as nonsampling error could affect the conclusions drawn from the estimates.
Response Metrics:
For the 2017 Economic Census, the Census Bureau produced new response metrics in accordance with Census Bureau standard response rate calculations, in order to monitor data collection and to provide additional indicators of data quality. These are the Unit Response Rate (URR), the Total Quantity Response Rate (TQRR), the Quantity Response Rate (QRR), the Administrative Data Rate (ADR), and the Imputation Rate (IR). (For definitions, see the Census Bureau Statistical Quality Standards, Appendix D3-B: Requirements for Calculating and Reporting Response Rates: Economic Surveys and Censuses, at https://www.census.gov/about/policies/quality/standards/appendixd3b.html.)
To produce these rates, the Census Bureau implemented a more detailed method for documenting the sources of data used for correcting estimated or inconsistent data. These correction sources align with those used in the Census Bureau’s annual economic surveys, and are defined as follows:
- corrections obtained directly from respondents;
- data from administrative sources;
- data from other survey(s) with the same reference period;
- data from another reliable secondary source for the same reference period; or
- estimates by industry analysts based on, for example, prior year data or industry averages.
When calculating the standard response metrics, the first four types of corrections are treated in the same manner as “reported” data. For the fifth type of correction, the data are treated as imputed. Census Bureau analysts’ estimates were treated as reported data for prior Economic Census reporting periods. Data users should be advised that imputation rates calculated for the 2017 Economic Census are larger than similar metrics calculated for prior Economic Censuses, due to these procedural changes and to unit and item nonresponse in the classical sense. The 2017 Economic Census was hampered by funding issues and delayed as a result of the partial government shutdown in January 2019. Imputation rates are indicated with tabulated 2017 Economic Census data using a coding scheme like that presented with 2012 Economic Census data, as follows:
- 0: Imputation rate is less than 10%
- 1: Imputation rate is greater than or equal to 10% but less than 20%
- 2: Imputation rate is greater than or equal to 20% but less than 30%
- 3: Imputation rate is greater than or equal to 30% but less than 40%
- 4: Imputation rate is greater than or equal to 40% but less than 50%
- 5: Imputation rate is greater than or equal to 50% but less than 60%
- 6: Imputation rate is greater than or equal to 60% but less than 70%
- 7: Imputation rate is greater than or equal to 70% but less than 80%
- 8: Imputation rate is greater than or equal to 80% but less than 90%
- 9: Imputation rate is greater than or equal to 90%
The URR for the 2017 Economic Census was just over 62%.
Qualitative research, utilizing techniques such as cognitive interviews or usability testing methods, may be undertaken to assess the performance of new or substantially changed survey questions or data collection instruments, and results are usually used to aid design decisions in order to reduce measurement error and response burden. Post-collection debriefing interviews may be conducted with respondents in order to evaluate the performance of questions/instruments, to identify error sources and recommend modifications for future collections. If available, paradata may also be examined to identify problematic questions or instrument designs for further improvement. Reports of findings and recommendations are prepared from these studies and provided to survey managers and sponsors, and may be publicly available pursuant to confidentiality and disclosure requirements.
Disclosure avoidance:
Disclosure is the release of data that reveals information or permits deduction of information about a particular survey unit through the release of either tables or microdata. Disclosure avoidance is the process used to protect each survey unit’s identity and data from disclosure. Using disclosure avoidance procedures, the Census Bureau modifies or removes the characteristics that put information at risk of disclosure.
Cell suppression is a disclosure avoidance technique that protects the confidentiality of individual survey units by withholding the values of certain cells within a table from release and replacing the cell value with a symbol, usually a “D”. If the suppressed cell value were known, it would allow one to estimate an individual survey unit’s data too closely.
The cells that must be protected are called primary suppressions. To make sure the cell values of the primary suppressions cannot be closely estimated by using other published cell values, additional cells may also be suppressed. These additional suppressed cells are called complementary suppressions.
The process of suppression does not change the higher-level totals. Values for cells that are not suppressed remain unchanged. Before the Census Bureau releases data, computer programs and analysts ensure primary and complementary suppressions have been correctly applied.
Rounding, either from the way data is collected or published, may effect whether a small number is considered a primary suppression. Ranges are sometimes used in place of D’s to suppress sensitive data, but still provide some meaningful information.
Background on cell suppression, cell sensitivity and the protection of statistical data can be obtain from the Federal Committee on Statistical Methodology's Working Paper 22. The Census Bureau has reviewed the 2017 Economic Census data products for unauthorized disclosure of confidential information and has approved the disclosure practices applied. (Approval IDs: CBDRB-FY19-537 [general procedures], CBDRB-FY20-360 [SIZE tables], CBDRB-FY20-283 [SIZE tables/Herfindahl-Hirschman Index], CBDRB-FY21-071 [Location tables])
History of Survey Program:
For more information on the history of the Economic Census, see the following page from the Census Bureau’s history site:
https://www.census.gov/about/history/historical-censuses-and-surveys/census-programs-surveys/economic-census.html
For more information on new content for the 2017 Economic Census and changes from the 2012 Economic Census, see the following page:
https://www.census.gov/programs-surveys/economic-census/news-updates/whats-new.html
References:
Bechtel, Steeg Morris, and Thompson. 2015. “Using Classification Trees to Recommend HDI Methods: A Case Study”. Proceedings of the FCSM Research Conference.
Knutson, Thompson, and Thompson. 2017. “Developing Variance Estimates for Products in the Economics Census. Proceedings of the Governments Statistics Section, American Statistical Association.
Xie, X. and Meng, X.L. 2017. “Dissecting Multiple Imputation from a Multi-Phase Inference Perspective:What Happens When God’s, Imputer’s and Analyst’s Models Are Uncongenial?”, Statistica Sinica 27(4): 1485-1544. doi:10.5705/ss.2014.067
Zhou, H., Raghunathan, T., and Elliot, M. 2012. “A Semi-Parametric Approach to Account for Complex Designs in Multiple Imputation”. Proceedings of the FCSM Research Conference.
Page Last Revised - February 12, 2025
✕
Is this page helpful?
 Yes
Yes
 No
No
 Yes
Yes
 No
No✕
NO THANKS
255 characters maximum
 255 characters maximum reached
✕
Thank you for your feedback.
Comments or suggestions?

Comments or suggestions?