Methodology for the 2022 Economic Census - Island Areas
Methodology for the 2022 Economic Census - Island Areas
In This Section
Survey Design
Target population
The target population of the 2022 Economic Census of Island Areas consists of all establishments (generally single physical locations where business is conducted or where services or industrial operations are performed) that:
- are in operation for at least some part of 2022,
- are located in Puerto Rico, the U.S. Virgin Islands, Guam, the Commonwealth of the Northern Mariana Islands, or American Samoa,
- have paid employees, and
- are classified in one of eighteen in-scope sectors defined by the North American Industry Classification System (NAICS).
The 2022 Economic Census covers the following NAICS sectors of the U.S. Island Areas economy:
- 21 – Mining, Quarrying, and Oil and Gas Extraction
- 22 – Utilities
- 23 – Construction
- 31-33 – Manufacturing
- 42 – Wholesale Trade
- 44-45 – Retail Trade
- 48-49 – Transportation and Warehousing (not including 482 – Rail Transportation or 491 – Postal Service)
- 51 – Information
- 52 – Finance and Insurance (not including 525 – Funds, Trusts, and Other Financial Vehicles)
- 53 – Real Estate and Rental and Leasing
- 54 – Professional, Scientific and Technical Services
- 55 – Management of Companies and Enterprises
- 56 – Administrative and Support and Waste Management and Remediation Services
- 61 – Educational Services (not including 6111 – Elementary and Secondary Schools, 6112 – Junior Colleges, or 6113 – Colleges, Universities, and Professional Schools)
- 62 – Health Care and Social Assistance
- 71 – Arts, Entertainment, and Recreation
- 72 – Accommodation and Food Services
- 81 – Other Services (Except Public Administration) (not including 8131 – Religious Organizations, 81393 – Labor Unions and Similar Labor Organizations, 81394 – Political Organizations, or 814 – Private Households)
More detailed descriptions of these sectors can be found at the Census Bureau’s NAICS webpage.
The following industries (NAICS) are not covered by the 2022 Economic Census of Island Areas:
- 11 – Agriculture, Forestry, Fishing and Hunting
- 482 – Rail Transportation
- 491 – Postal Service
- 525 – Funds, Trusts, and Other Financial Vehicles
- 6111 – Elementary and Secondary Schools
- 6112 – Junior Colleges
- 6113 – Colleges, Universities, and Professional Schools
- 8131 – Religious Organizations
- 81393 – Labor Unions and Similar Labor Organizations
- 81394 – Political Organizations
- 814 – Private Households
- 92 – Public Administration
Sampling frame
The Economic Census of the Island Areas selects establishments for its sample from a frame obtained from the U.S. Census Bureau’s Business Register. The Business Register contains information on the physical location of establishments, as well as payroll, employment, receipts (value of shipments), and industry classification data obtained from prior censuses and surveys or obtained from the administrative records of the Internal Revenue Service (IRS) and Social Security Administration (SSA) under special arrangements which safeguard the confidentiality of both tax and census records. Information from the Bureau of Labor Statistics on industry classifications is also used to supplement the classification information from the IRS and SSA.
To be included on the sampling frame, an establishment was required to satisfy the following conditions:
- it must be classified in an in-scope NAICS industry,
- it must be an active establishment of a multi-unit firm, or it must be a single establishment firm with at least one quarter of 2022 administrative payroll or 2021Q4 administrative payroll, and
- it must be located in Puerto Rico, the U.S. Virgin Islands, Guam, the Commonwealth of the Northern Mariana Islands, or American Samoa.
Sampling units and design
The basic sampling unit is the establishment.
The Economic Census of Island Areas is a complete enumeration of establishments located in the islands (i.e., all establishments on the sampling frame are included in the sample). Therefore, the accuracy of tabulations is not affected by sampling error.
Frequency of sample redesign
A new sampling frame is created every five years for each iteration of the Economic Census of Island Areas.
Sample maintenance
Since the Economic Census of Island Areas is a complete enumeration of establishments, all establishments on the sampling frame were included. The initial sampling frame was created in September 2022. A second frame of single-establishment firms was created in November 2022 from those establishments on the Business Register with payroll in 2022 that were not on the initial sampling frame. Similarly, a third frame of single-establishment firms was created in March 2023 from those establishments on the Business Register with 2022 payroll that were not included on the previous two sampling frames. These last two frame creation processes occurred to include establishments that were likely active in 2022 but were not on the initial sampling frame due to the lag between the time they became active and the time they were added to the Business Resister.
Data Collection
Data items requested and reference period covered
The questionnaires in English for the 2022 Economic Census of Island Areas can be found at the following repository: https://bhs.econ.census.gov/ombpdfs2022/. Please filter to 2022_ECON-ISLAND_AREAS in the TRADE column to see the questionnaires for the islands.
The Spanish-language questionnaires are in a section titled 2022 Spanish-Language Economic Census Questionnaires (PDF) at the following webpage: https://www.census.gov/programs-surveys/economic-census/island-areas/2022.html.
The reference period is the calendar year 2022.
Key data items
The key data items are the sales, value of shipments, or revenue; annual payroll; first-quarter payroll; and number of employees.
Type of request
The Economic Census of Island Areas is a mandatory survey and response is required by law. Title 13, United States Code, Sections 131, 182, 191, 224, and 225, authorizes this collection and requires businesses and other organizations included in the survey to answer the questions and submit a response.
Frequency and mode of contact
The 2022 Economic Census of Island Areas utilized a collection strategy offering both electronic and paper reporting options, depending on the type of respondent. Single-unit businesses were initially mailed a letter with instructions on how to report electronically. Single-unit follow-up mailings contained a letter with electronic reporting instructions along with a paper copy of the questionnaire. Paper forms were also available on demand throughout the collection period for single units. Multiunit businesses received only letters with electronic reporting instructions, in both the initial and follow-up mailings.
Approximately 55,000 establishments were contacted in the initial mailing. For Puerto Rico, the collection strategy included four follow-up mailings and an outgoing telephone follow-up. For other island areas, the collection strategy included three follow-up mailings and telephone follow-up conducted by the local governments.
The Census Bureau published information to help respondents understand the program. See 2022 Economic Census Information for Respondents for details.
Data collection unit
The data collection unit is the establishment.
The counts of establishments in the islands were the following:
- American Samoa: 593
- Commonwealth of the Northern Mariana Islands: 1523
- Guam: 3412
- U.S. Virgin Islands: 2300
- Puerto Rico: 48,253
Compilation of Data
Editing
The Economic Census of Island Areas utilizes an editing procedure that detects erroneous survey data or questionable survey data. In other words, editing is a process for detecting incorrect (keyed or respondent) data. Editing does not include changing the data. If data fail an edit the data are either referred to an analyst for review and correction or automatically imputed.
There are different editing methods: data validation edits, consistency edits, and ratio edits. Data validation edits check if the value of a data item comes from a given set of acceptable values. Examples of range validation edits are range edits and list directed edits. Range edits verify that data fall within a prespecified range for continuous data, for example checking that an estimate of a percentage is between 0 percent and 100 percent. List directed edits verify that existing data values for a specified data item match predefined values provided in the questionnaire. For example, all the yes or no questions on the forms can only have values of 1 or 2 for yes and no, respectively.
Consistency edits check the response item against other associated responses or items to determine if a predefined relationship is followed. Examples of consistency edits are balance edits and skip pattern validation edits. Balance edits verify if the sum of detail items is equal to a data item total. An example of a balance test is when annual payroll details do not equal to the total annual payroll. The skip pattern edits verify that values of skip items are consistent with skip instructions provided in the questionnaire. An example of a skip pattern is the e-commerce question. If the establishment had any e-commerce transactions, the respondent would provide the percent, if not the respondent would move on to the next question.
Ratio edits verify if the ratios of data items are within a certain range. Examples of ratio edits are current cell ratio edits and historic cell ratio cells. The current cell ratio edits verify that the ratio of two data items for the same establishment are within a certain range. For example, ratio edits help determine ratio inconsistencies between sales and annual payroll, annual payroll and hours, and annual payroll and number of employees. The historic cell ratio edits verify within an establishment that the ratio of a data item in the current census compared to a previous census is within a certain tolerance.
Other required edits for the Island Areas verify that a data value exists (i.e., the value is not blank) for a specified item. Edit tests are also needed to trigger or start general imputation if the question was left unanswered. If a variable needs to be filled by general imputation, it must have an edit test to begin the general editing process on it. Survey rule edits are free-form tests that validate complex inter-item relationships. Ratio edits are often implemented as survey rule tests. The most common edit tests used for Island Areas are range tests, list directed tests, balance tests, and survey rule tests.
Nonresponse
Nonresponse is defined as the inability to obtain requested data from an eligible survey unit. Two types of nonresponse are often distinguished. Unit nonresponse is the inability to obtain any of the substantive measurements about a unit. In most cases of unit nonresponse, the Census Bureau was unable to obtain any information from the survey unit after several attempts to elicit a response. Item nonresponse occurs either when a question is unanswered or the reported data is unusable.
Nonresponse adjustment and imputation
Nonresponse is handled by estimating or imputing missing data. Imputation is defined as the replacement of a missing or incorrectly reported item with another value derived from logical edits or statistical procedures. The primary methods for imputing missing basic data items (such as receipts, sales, payroll, and employment) are:
- using administrative data,
- deriving the missing data item from the establishment’s other data (either reported or administrative), and
- deriving the missing data item by statistical methods using data reported by similar establishments.
For many items, missing data is filled in using an auxiliary ratio method, which assumes a correlation between data items. For example, the auxiliary ratio equation for deriving missing receipts is as follows:
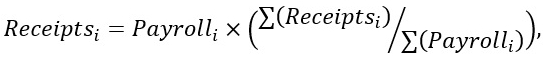
where Receiptsi is the missing receipt values being derived for establishment i, Payrolli is the annual payroll value for establishment i, and Σ(Receiptsj) and Σ(Payrollj) are the sums of all respondent receipts and annual payrolls within the imputation base. If there are enough respondents which have passed certain edits tests in the same 5-digit NAICS as establishment i, then these respondents make up the imputation base for the item being imputed. Otherwise, the same check of establishments is done within the same 4-digit NAICS as establishment i. The procedure continues up to the sector level until there are enough establishments that pass edit tests to form an imputation base. Nonresponse for some other items is adjusted at the estimate level using expansion factors. See the “Estimation” section for more information on this method.
Tabulation unit
The tabulation unit is the establishment.
Estimation
Most estimates are simple summations of reported data, administrative data, and imputed data from all in-scope establishments. The most common source of imputed data is administrative data from the IRS. Dollar values are published in current dollars. In tables that compare the current census to a prior census, no adjustment has been made to the estimates to account for inflation during the intervening period.
The North American Product Classification System (NAPCS) tables, e-commerce tables, employment by function tables, storage space tables, class of customer tables, type of construction tables, and capital expenditures tables use expansion factors to account for nonresponse. The remainder of this section outlines how the expansion factors are calculated and used.
An expansion factor is used to account for NAPCS product nonresponse. The nonresponse adjustment factor is calculated as follows:

In any industry with complete response for NAPCS, FACTOR = 1 since the total receipts is the same value as the reported broad line NAPCS total. Otherwise, FACTOR > 1, and multiplying the total reported NAPCS by FACTOR will expand the NAPCS total so that the total adjusted NAPCS equals total receipts.
A similar expansion factor is used on the e-commerce, storage space, class of customer, type of construction, capital expenditures, and employment by function tables. For those tables, the nonresponse adjustment factor is calculated as follows:

Using this factor assumes that the level of response for e-commerce receipts is similar to the level of response for total receipts, and likewise for the levels of response in the other tables that have a nonresponse adjustment mentioned above.
A separate expansion factor for establishment counts is calculated for the NAPCS tables for the count of establishments with a given NAPCS line. The NAPCS establishment count expansion factor is calculated as follows:

The counts of establishments with a reported value for a given NAPCS product are multiplied by these factors to account for nonresponse.
A similar factor is used for counts of establishments in the remaining tables that have a nonresponse adjustment:

All expansion factors are calculated at the 4-digit NAICS industry level, except for factors used in the class of customer tables. The class of customer tables have expansion factors calculated at the 5-digit NAICS industry level.
Nonsampling error
Nonsampling error encompasses all factors other than sampling error that contribute to the total error associated with an estimate. This error may also be present in censuses and other nonsurvey programs. Nonsampling error arises from many sources: inability to obtain information on all units in the sample; response errors; differences in the interpretation of the questions; mismatches between sampling units and reporting units, requested data and data available or accessible in respondents' records, or with regard to reference periods; mistakes in coding or keying the data obtained; and other errors of collection, response, coverage, and processing.
Although no direct measurement of nonsampling error was obtained, precautionary steps were taken in all phases of the collection, processing, and tabulation of the data in an effort to minimize its influence. Precise estimation of the magnitude of nonsampling errors would require special experiments or access to independent data and, consequently, the magnitudes are often unavailable. The Census Bureau recommends that individuals using these estimates factor in this information when assessing their analyses of these data, as nonsampling error could affect the conclusions drawn from the estimates.
The Economic Census of Island Areas used the following means to maximize response:
- Public awareness campaign to assist businesses and the public in understanding the importance of the 2022 Economic Census of Island Areas by providing news stories through trade and professional associations, chambers of commerce, and business and general media;
- Assignment of account managers to large businesses to provide personalized assistance;
- Redesigned census questionnaires and information sheets with standard formats and terminology that try to simplify reporting and minimize response burden;
- Providing the option for single-unit establishments to respond using paper forms in English and Spanish;
- Mailing materials that emphasize the mandatory and confidential nature of economic census reports, as provided by Title 13 U.S.C.;
- Toll-free assistance and a web-based help desk for any business that had questions about completing the questionnaires;
- Systematic mail follow-up for nonresponse, supplemented by telephone follow-up for selected firms; and
- A respondent portal to provide answers to frequently asked questions, send secure emails to Census Bureau staff, report electronically, and perform other self-service options without having to pick up the phone.
Response metrics
For the 2022 Economic Census of Island Areas, the Census Bureau produced response metrics in accordance with Census Bureau standard response rate calculations to monitor data collection and to provide additional indicators of data quality. These are the Unit Response Rate (URR), the Total Quantity Response Rate (TQRR), the Quantity Response Rate (QRR), the Administrative Data Rate (ADR), and the Imputation Rate (IR). (For definitions, see the Census Bureau Statistical Quality Standards, Appendix D3-B: Requirements for Calculating and Reporting Response Rates: Economic Surveys and Censuses, at https://www.census.gov/about/policies/quality/standards/appendixd3b.html.)
To produce these rates, the Census Bureau implemented a detailed method for documenting the sources of data used for correcting estimated or inconsistent data. These correction sources align with those used in the Census Bureau’s annual economic surveys, and are defined as follows:
- obtained directly from respondents,
- obtained from administrative sources,
- estimated by industry analysts based on data reported by similar establishments.
When calculating the standard response metrics, the first two types of corrections are treated in the same manner as “reported” data. For the third type of correction, the data are treated as imputed. Imputation rates are indicated with tabulated 2022 Economic Census of Island Areas data using a coding scheme as follows:
- 0: Imputation rate is less than 10%
- 1: Imputation rate is greater than or equal to 10% but less than 20%
- 2: Imputation rate is greater than or equal to 20% but less than 30%
- 3: Imputation rate is greater than or equal to 30% but less than 40%
- 4: Imputation rate is greater than or equal to 40% but less than 50%
- 5: Imputation rate is greater than or equal to 50% but less than 60%
- 6: Imputation rate is greater than or equal to 60% but less than 70%
- 7: Imputation rate is greater than or equal to 70% but less than 80%
- 8: Imputation rate is greater than or equal to 80% but less than 90%
- 9: Imputation rate is greater than or equal to 90%
The URRs for the islands were the following:
- American Samoa: about 65%
- Commonwealth of the Northern Mariana Islands: about 74%
- Guam: about 71%
- U.S. Virgin Islands: about 59%
- Puerto Rico: about 58%
Disclosure avoidance
Disclosure is the release of data that reveals information or permits deduction of information about a particular survey unit through the release of either tables or microdata. Disclosure avoidance is the process used to protect each survey unit’s identity and data from disclosure. Using disclosure avoidance procedures, the Census Bureau modifies or removes the characteristics that put information at risk of disclosure. Although it may appear that a table shows information about a specific survey unit, the Census Bureau has taken steps to disguise or suppress a unit’s data that may be “at risk” of disclosure while making sure the results are still useful.
The Economic Census of Island Areas uses noise infusion as its primary method of disclosure avoidance.
Noise infusion is a method of disclosure avoidance in which the quantitative data values for each tabulation unit are perturbed prior to tabulation by applying a random noise multiplier to the magnitude data, such as sales or payroll. Each record is assigned a single noise factor, which is applied to each quantitative data item as part of the estimation process. Disclosure protection is accomplished in a manner that causes the vast majority of published cell values to be perturbed by, at most, a few percentage points.
The Economic Census of Island Areas employs a noise infusion method that balances the noise on receipts at the 3-digit NAICS level. This means that using the receipts item, the noise factors are assigned in such a way to attempt to minimize the final total noise in that cell. This is accomplished by sorting the establishment records within a cell by receipts and sequentially assigning noise at each stage to have the opposite sign of the total effect of noise in the cell. This does not completely eliminate noise, but it can significantly reduce the effect of noise at the 3-digit NAICS levels and above.
Each published cell value has an associated noise flag indicating the relative amount of distortion in the cell value resulting from the perturbation of the data for the contributors to the cell. The flag for ‘low noise’ (G) indicates the cell value was changed by less than 2 percent by the application of noise, and the flag for ‘moderate noise’ (H) indicates the value was changed by at least 2 percent but less than 8 percent. Cells that have been changed by 8 percent or more have a flag for ‘high noise’ (J).
Beginning with reference year 2017, a cell is only published if it contains three or more establishments. In all other cases, the cell is not included in the release (i.e., it is dropped from publication). For an introduction to the noise disclosure avoidance method, see Using Noise for Disclosure Limitation of Establishment Tabular Data by Timothy Evans, Laura Zayatz, and John Slanta in the Journal of Official Statistics (1998).
The Census Bureau has reviewed published data products for appropriate access, use, and disclosure avoidance protection of the confidential source data (Project No. 7504609, Disclosure Review Board approval number: CBDRB-FY24-0044).
For more information on disclosure avoidance practices, see Federal Committee on Statistical Methodology's Working Paper 22 (Harris-Kojetin et al, 2005).
History of Program
The Economic Census has been taken at 5-year intervals for the following areas, except where noted below:
- American Samoa — Since 2002
- Guam — Since 1958
- Commonwealth the Northern Mariana Islands — Since 1982
- U.S. Virgin Islands — Since 1958
- Puerto Rico — Economic Censuses were conducted beginning with a census of manufactures for 1909 and continuing at 10-year intervals through 1949, excepting 1929. Wholesale and retail trades and services industries were included as part of the economic censuses for 1939. Starting with 1949 through 2002, the censuses of wholesale and retail trades and service industries have been conducted concurrently with the census of manufactures. The census of construction industries has been included since 1967. Congress has authorized the economic censuses to be taken at 5-year intervals covering years ending in "2" and "7."
The range of industries covered in the economic census for American Samoa, the Commonwealth of the Northern Mariana Islands, Guam, the U.S. Virgin Islands, and Puerto Rico was broadened in 2002. Sectors added for the first time in 2002 include information, finance and insurance, real estate, health care, and other service industries.
Printed statistical reports from the 2002 and earlier censuses provide historical data for the Commonwealth of the Northern Mariana Islands, Guam, and the U.S. Virgin Islands, and are available in some libraries. For American Samoa only, the 2002 printed report provides historical data. Printed reports from 1997 and earlier censuses provide historical data for Puerto Rico. Reports for 1992, 1997, and 2002 are also available in portable document format (PDF) on the Internet.
References
Harris-Kojetin, B.A., Alvey, W.L., Carson, L., Cohen, S.B. and others. (2005). Report on Statistical Disclosure Limitation Methodology. Statistical Policy Working Paper No. 22, Federal Committee on Statistical Methodology. https://www.fcsm.gov/assets/files/docs/spwp22WithFrontNote.pdf.