E-Stats Methodology
E-Stats Methodology
Introduction
The estimates in this release are based on the data collected by the U.S. Census Bureau for the following surveys: the Economic Census (EC)-Manufacturing, Annual Survey of Manufactures (ASM), the Service Annual Survey (SAS), the Annual Retail Trade Survey (ARTS), and the Annual Wholesale Trade Survey (AWTS).
All of these surveys were conducted independently. Measures of total economic activity and e-commerce are presented to provide a broad perspective of e-commerce activity across the many sectors. Brief descriptions of the survey methods are given below.
Industry classifications used are based on the North American Industry Classification System (NAICS). Information about the NAICS and additional detail about coverage, sample design, and estimation methodology for the annual surveys may be found at www.census.gov/programs-surveys/e-stats.html. In addition, all current and prior reports, historical data tables, and past research papers are available at this same web site.
Coverage, Sample Design, and Estimation Summaries
Economic Census-Manufacturing and Annual Survey of Manufactures
The 2022 data were obtained from the EC-Manufacturing. The manufacturing universe is comprised of approximately 290,000 establishments. In the census, data are collected from establishments above a specified payroll cutoff that can vary by industry. Data for nonresponding establishments were imputed using information from responding establishments with similar characteristics. Data produced from the 2022 Economic Census are based on the 2022 NAICS.
The 2021 estimates of manufacturing shipments and e-shipments were derived from the ASM. The ASM is a survey of manufacturing establishments and represents activities at individual establishments rather than the entire company. In the ASM, data are collected annually from a probability sample of approximately 50,000 manufacturing plants as defined by the 2017 NAICS. Data for small- and medium-sized single establishment companies are estimated using information obtained from administrative sources. Data for nonresponding plants were imputed using information from responding plants with similar characteristics.
The EC-Manufacturing and the ASM measure value of shipments. Value of shipments is the value of all products shipped. Value of shipments includes shipments to outside customers, as well as affiliated establishments.
E-commerce shipments (e-shipments) are online orders accepted for manufactured products from customers, including shipments to other domestic establishments of the same company for further manufacture, assembly or fabrication where price and terms of sale are negotiated over the Internet, Extranet, Electronic Data Interchange (EDI) network, e-mail, or other online system. Payment may or may not be made online.
Shipments estimates for the NAICS subsectors were calculated by summing both the reported and the imputed plant data. For the ASM, the data were weighted by the reciprocal of the probability of the plant’s selection in the sample. The total shipment estimates were then linked to the 2017 Economic Census results to reduce sampling and nonsampling errors.
Service Annual Survey
The SAS measures the economic activity of employer firms classified in 12 service-related sectors as defined by the 2017 NAICS:
- Utilities
- Transportation and Warehousing
- Information
- Finance and Insurance
- Real Estate and Rental and Leasing
- Professional, Scientific, and Technical Services
- Administrative and Support and Waste Management and Remediation Services
- Educational Services
- Health Care and Social Assistance
- Arts, Entertainment, and Recreation
- Accommodation and Food Services
- Other Services (except Public Administration).
Data are requested annually from a stratified random sample of approximately 90,000 firms, selected from a sampling frame constructed using information from the 2012 Economic Census and updated with information from the Census Bureau’s Business Register.
The SAS measures revenues. Revenues are the dollar value of transactions and contracts between reporting firms and their customers. These values include services performed for foreign affiliates, but exclude transactions among domestic affiliates. Revenues include the total value of service contracts, the market value of compensation received in lieu of cash, amounts received for work subcontracted to others, and other industry-specific items.
Revenues from electronic sources include revenues from customers entering orders directly on a firm’s Web site or mobile application, revenues from customers entering orders directly on third party Web sites or mobile applications, and revenues from customers entering orders via any other electronic system (such as private networks, dedicated lines, kiosks, etc.)
Firms surveyed are asked to report total revenues and revenues from electronic sources. Revenues from electronic sources data for nonresponding employer firms were imputed based on data from responding firms within the same kind of business. Estimates of total revenues and revenues from electronic sources were calculated by summing data (both reported and imputed) weighted by the reciprocal of the probability of the firm’s selection in the sample. The estimates were then adjusted using results of the 2017 Economic Census to reduce sampling error and to allow comparability with the census results.
Annual Retail Trade Survey
The ARTS measures the economic activity of employer firms classified in Retail Trade as defined by the 2017 NAICS. The sample contains approximately 16,500 firms with paid employees, selected from a sampling frame constructed using information from the 2012 Economic Census and updated with information from the Census Bureau’s Business Register. In previous releases of the ARTS, firms without paid employees, or nonemployers, were included in the estimates through imputation or administrative data provided by other federal agencies.
The ARTS measures sales. Sales are the dollar value of transactions between the reporting firm and its customers. Sales include transactions to foreign affiliates but exclude transactions among domestic affiliates.
E-commerce sales are sales of goods and services where the buyer places an order, or the price and terms of the sale are negotiated, over the Internet, mobile device (m-commerce), Extranet, EDI network, e-mail, or other comparable online system. Payment may or may not be made online.
Firms surveyed are asked to report total sales and e-commerce sales. Firms in the Electronic Shopping and Mail-Order Houses industry are also asked to report total sales and e-commerce sales for specific merchandise lines. E-commerce data for nonresponding employer firms were imputed based on data from responding firms within the same kind of business. Estimates of total sales and e-commerce sales were calculated by summing data (both reported and imputed) weighted by the reciprocal of the probability of the firm’s selection in the sample. The estimates were then adjusted using results of the 2017 Economic Census to reduce sampling error and to allow comparability with the census results.
Annual Wholesale Trade Survey
The AWTS measures the economic activity of merchant wholesale firms with paid employees (i.e., employer firms), including manufacturers' sales branches and offices (MSBOs), as defined by the 2017 NAICS. Merchant wholesale firms are those that take title to the goods they sell. Data are requested annually from approximately 6,700 merchant firms (excluding MSBOs) and 1,000 MSBOs, selected from a sampling frame constructed using information from the 2012 Economic Census and updated with information from the Census Bureau’s Business Register.
The AWTS also measures sales. The AWTS uses the same definitions of sales and e-commerce sales as the ARTS.
Firms surveyed are asked to report total sales, e-commerce sales, and e-commerce sales made through EDI networks. E-commerce data for nonresponding employer firms were imputed based on data from responding firms within the same kind of business. Estimates of total sales and e-commerce sales were calculated by summing data (both reported and imputed) weighted by the reciprocal of the probability of the firm’s selection in the sample. The estimates were then adjusted using results of the 2017 Economic Census to reduce sampling error and to allow comparability with the census results.
Reliability of Estimates
The estimates presented are based on sample surveys and are subject to sampling error and nonsampling error. Sampling error occurs because only a subset of the entire population is measured. Nonsampling error encompasses all other factors that contribute to the total error of a sample survey estimate and may occur in censuses.
Sampling Error
Two measures of sampling error are provided for data in this release—standard errors for estimates of percentages and coefficients of variation (CV) for estimates of total dollar value. The standard error measures the extent to which estimates derived from all possible samples of the same size drawn using the same design differ from the average of these estimates. The coefficient of variation (expressed as a percentage) is the standard error of the estimate divided by the estimate. Note that standard errors and coefficients of variation are estimates derived from the sample and are also subject to sampling error. The coefficients of variation and standard errors may be used to compute confidence intervals about the sample estimates.
The particular sample used for each survey included in this report is one of a large number of samples of the same size that could have been selected using the same design. For the ASM, we estimate sampling variances using the Poisson variance estimator rather than the method of random groups. In about 9 out of 10 (90 percent) of the possible samples, the estimates would differ from the results of a complete enumeration by less than 1.645 times the estimated standard error. For the AWTS, ARTS, and SAS, we use the method of random groups (G=16 random groups) to estimate sampling variances for estimates produced from these samples. In about 9 out of 10 (90 percent) of the possible samples, the estimates would differ from the results of a complete enumeration by less than 1.753 (a t-statistic with 15 [G-1] degrees of freedom) times the estimated standard error. To compute a 90 percent confidence interval for an estimated total, multiply the estimate by its coefficient of variation and then by either 1.753 or 1.645, as indicated above. This amount is then added to and subtracted from the estimate to give the upper and lower bounds of the interval. As an example, suppose the estimated total revenue is $51,770 million and the estimated coefficient of variation for this estimate is 1.3 percent (0.013). Multiplying $51,770 million by 0.013 and by 1.753 gives $1,180 million. Subtracting $1,180 million from and adding $1,180 million to $51,770 million gives a 90 percent confidence interval of $50,590 million to $52,950 million. Confidence statements for estimated percentages are computed in a similar manner. The Census Bureau recommends that individuals using estimates in this release incorporate this information into their analyses, as sampling error could affect the conclusions drawn from these estimates. All comparisons in this release have undergone statistical testing and, unless otherwise noted, comparisons are statistically significant at the 90 percent confidence level.
Nonsampling Error
One source of nonsampling error is the inability to obtain response for all cases in the sample. One measure of this type of nonsampling error is response rates. Economic surveys at the Census Bureau are required to compute two different types of response rates: a unit response rate and weighted item response rates. Refer to each survey’s web site (links provided at www.census.gov/programs-surveys/e-stats/about/related-sites.html) for the unit response rates of the surveys that contribute to this report. The weighted item response rates are called Total Quantity Response Rates (TQRR) and are item-level indicators of the quality of each estimate.
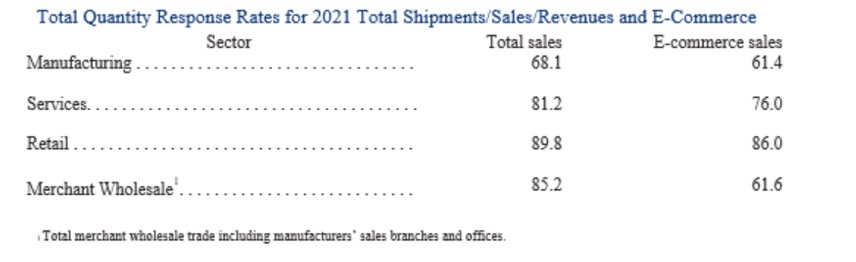
It is important to highlight that the TQRR for Merchant Wholesale e-commerce sales was 40.4 percent for the 2022 statistical period. A decision was made to release this e-commerce sales estimate (and its corresponding measure of sampling variability) instead of suppressing the estimate (i.e., instead of replacing the estimate with "S”), because this is a 2-digit NAICS code estimate. Data users should be aware of the TQRR for this estimate and use caution when drawing conclusions from this estimate.
More detailed information about calculating and reporting response rates for economic surveys can be found at www.census.gov/about/policies/quality/standards/appendixd3b.html. Other sources of nonsampling error include response errors, unclear definitions, differences in the interpretation of questions, mistakes in recording or coding the data obtained, and other errors of collection, response, coverage, and estimation of missing data. Although no direct measures of these sources of nonsampling error have been obtained, precautionary steps were taken in all phases of the collection, processing, and tabulation of the data in an effort to minimize their influence.
Disclosure Avoidance
Disclosure is the release of data that reveals information or permits deduction of information about a particular survey unit through the release of either tables or microdata. Disclosure avoidance is the process used to protect each survey unit’s identity and data from disclosure. Using disclosure avoidance procedures, the Census Bureau modifies or removes the characteristics that put information at risk of disclosure. Although it may appear that a table shows information about a specific survey unit, the Census Bureau has taken steps to disguise or suppress a unit’s data that may be “at risk” of disclosure while making sure the results are still useful.[2]
______________________________________
[2] The Census Bureau has reviewed the data product for unauthorized disclosure of confidential information and has approved the disclosure avoidance practices applied.
ARTS Approval ID: CBDRB-FY24-0053
AWTS Approval ID: CBDRB-FY24-0052
ASM Approval ID: CBDRB-FY23-086
EC Approval ID: CBDRB-FY23-099
SAS Approval ID: CBDRB-FY23-0393, CBDRB-FY24-0054