
Official websites use .gov
A .gov website belongs to an official government organization in the United States.
Secure .gov websites use HTTPS
A lock (
) or https:// means you’ve safely connected to the .gov website. Share sensitive information only on official, secure websites.

Topics
Data & Maps
Surveys & Programs
Resource Library
Coverage Ratios
A coverage ratio compares the estimate from the sample of the number of people who have a particular characteristic to the same estimate from updated decennial census figures. For example, a coverage ratio of .95 for males aged 50 to 59 indicates that the CPS estimate of the number of persons in this subpopulation is 95% of the updated census population estimate. Occasionally, the coverage ratio exceeds 1.0 indicating overcoverage of a particular category.
In the CPS, coverage ratios are examined for various age/race/sex groupings. Prior to publication, adjustments are made to the weights using population control totals from the updated census estimates. This insures the estimated population from CPS is comparable to the updated census estimates for these particular groupings.
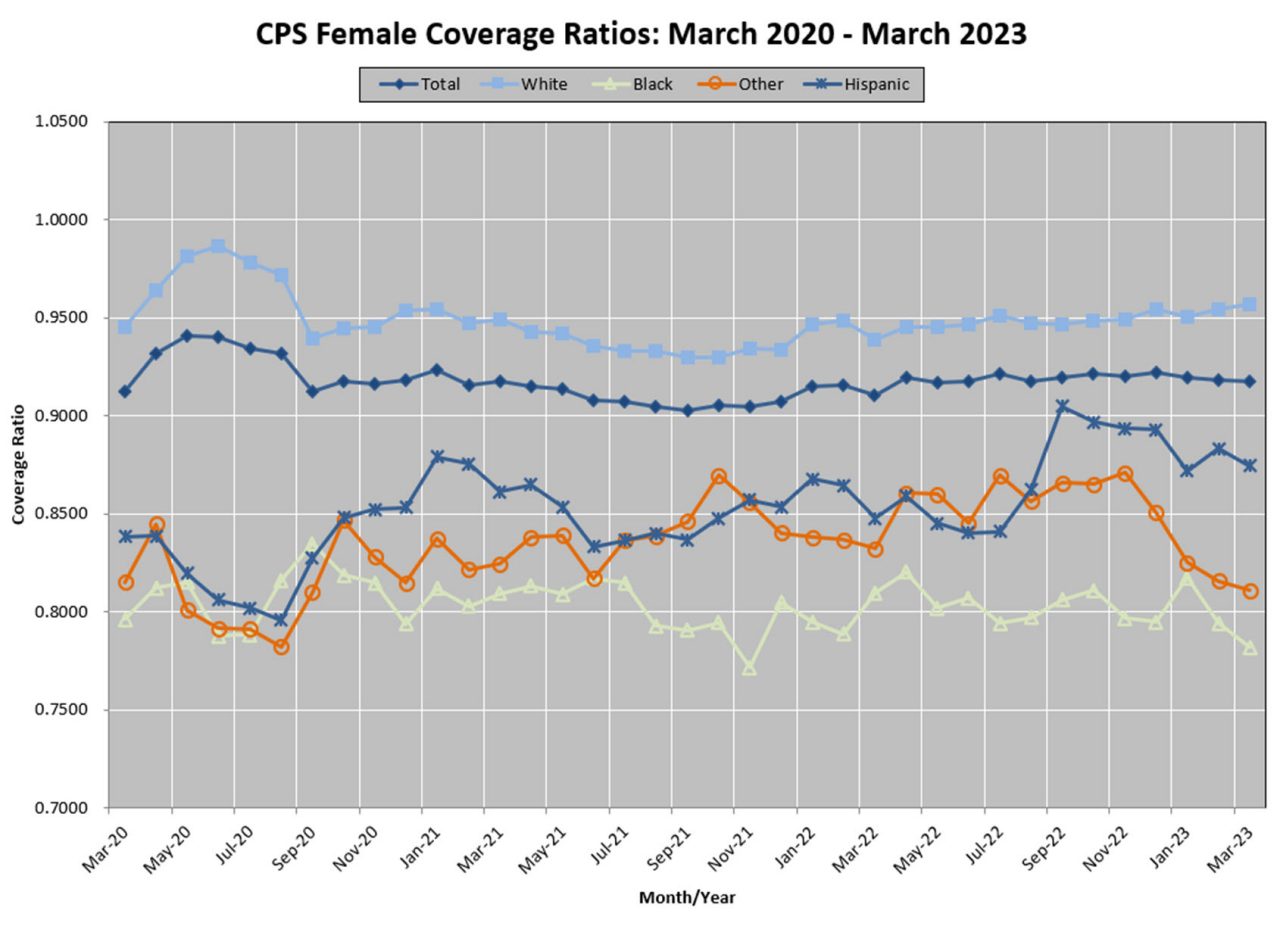
The three graphs provide a picture of coverage, for the 16+ population, in the CPS over the last three years. The first one gives the coverage ratios for racial groups. Traditionally, Blacks and Hispanics have been the most underrepresented in CPS. The other two graphs show the coverage ratios by race and gender. Coverage ratios are lowest for Black and Hispanic males.
CPS Total Coverage Ratios: March 2020-March 2023

CPS Female Coverage Ratios: March 2020-March 2023
CPS Male Coverage Ratios: March 2020-March 2023

Page Last Revised - April 27, 2023
✕
Is this page helpful?
 Yes
Yes
 No
No
 Yes
Yes
 No
No✕
NO THANKS
255 characters maximum
 255 characters maximum reached
✕
Thank you for your feedback.
Comments or suggestions?

Comments or suggestions?