ASM Methodology
ASM Methodology
Survey Design
Target population
The target population of the ASM consisted of active manufacturing establishments in the United States with one or more paid employees, and nonemployers that used leased employees for manufacturing. Nonemployers, i.e., firms subject to federal income tax, with no paid employees, were excluded from the ASM unless they were known to employ/lease manufacturing workers through a third party. Data for nonemployers are published in the annual Nonemployer Statistics series.
Sampling frame
The frame was constructed from the preceding Economic Census - Manufacturing database and supplemented with births from the Business Register. Only active records, that were eligible for Census tabulation, were included in the frame. The survey frame was updated from two sources: (1) Internal Revenue Service (IRS) administrative records were used to include new single-unit manufacturers; and (2) the Company Organization Survey (COS) identified new establishments of multi-unit firms.
Sampling unit
The sampling unit was the establishment.
Sample design
The recent Economic Censuses - Manufacturing contained about 290,000 active manufacturing establishments. For sample efficiency and cost considerations, the population was partitioned into two groups: (1) establishments eligible to be mailed a questionnaire; and (2) establishments not eligible to be mailed a questionnaire. The following is a description of the 2019 ASM sample design:
Note that the 2019 ASM sample design was similar to the 2014-2018 sample design. The only significant change was the products universe file was created from the North American Product Classification System (NAPCS) codes.
1. Establishments that were eligible to be mailed a questionnaire:
This was defined as the mail stratum and was comprised of larger single-location manufacturing companies and all manufacturing establishments of multi-location companies. The mail stratum was comprised of about 100,000 establishments in recent Economic Censuses. On an annual basis, the mail stratum was supplemented with large, newly active single-location companies identified from a list provided by the IRS and new manufacturing locations of multi-location companies identified from the Census Bureau’s COS.
Establishments in the 2017 Economic Census - Manufacturing that satisfied any of the following criteria were included in the 2019 sample with certainty: (1) the total 2017 employment for the establishment was greater than or equal to 1,000; (2) the establishment was identified as one of the ten largest establishments within the industry (based on employment); (3) the establishment was classified within an industry with less than 20 establishments; (4) the establishment was classified in the computer or flat-glass or sugar industry; (5) the establishment was located within a state where there were less than 20 additional establishments in the same North American Industry Classification System (NAICS) group (NAICS group is defined as the set of NAICS industries that have the same first four digits); or (6) the establishment was one of the largest establishments in terms of cost of fuels used, cost of electricity used, end-of-year inventories, end-of-year assets, or LIFO inventories. Collectively, there were about 17,000 establishments that were selected with certainty in the 2017 Economic Census. These establishments accounted for approximately 70 percent of the total value of shipments in the 2017 Economic Census - Manufacturing. Previous Economic Censuses had similar values.
Establishments in the remaining portion of the mail stratum were sampled with probabilities ranging from .05 to 1.00. In 2019, each of the 360 industries and 2,184 product classes were considered to be a separate population. Similarly in 2014, there were 364 industries and 1,390 product classes were considered to be a separate population. Using variable reliability constraints, each establishment within a given population was assigned an initial probability of selection that reflected its relative importance within the population. Establishments producing products in multiple product classes received multiple initial probabilities. The final probability of selection for a specific establishment was defined as the largest of their initial probabilities.
This method of assigning probabilities was motivated by the Census Bureau's primary desire to produce reliable estimates of both product class and industry shipments. The high correlation between shipments and employment, value-added, and other general statistics assured that these variables were also well represented. For sample selection purposes, each establishment was assigned to an industry stratum. Within each of the 360 industry strata in 2019, an independent sample was selected using the final probability of selection associated with the establishments classified within the stratum. A fixed-sample size methodology was used to assure that the desired sample size was realized. The target sample size was 50,000. The total sample size was 49,000 and 48,000 in 2019 and 2014 respectively.
2. Establishments not eligible to be mailed a questionnaire:
This was defined as the nonmail stratum and consisted of small- and medium-sized, single-establishment companies from the Economic Census - Manufacturing. The initial nonmail stratum of recent samples contained about 190,000 single-establishment companies from the Economic Census – Manufacturing.
The nonmail stratum was supplemented annually using the list of newly active single-location companies provided by the IRS. Data for establishments included in the nonmail stratum were estimated using information obtained from the administrative records of the IRS and Social Security Administration (SSA); and were included in the published ASM estimates. This administrative information, which includes payroll, total employment, industry classification, and physical location, was obtained under conditions which safeguard the confidentiality of both tax and census records.
Frequency of sample redesign
Every 5 years (implemented two years after each Economic Census - Manufacturing).
Sample maintenance
Since the ASM survey sample was redesigned every five years, there was a need for sample maintenance in the intervening years. Selected establishments remained in the sample as long as they were active and in scope. Births were identified and added annually. Single units that were newly classified into manufacturing were added annually. Deaths were removed as they were identified.
Data Collection
Sample
A new sample was selected at 5-year intervals beginning the second survey year subsequent to the Economic Census – Manufacturing. The last sample was selected in 2019, the second year following the 2017 Economic Census – Manufacturing. The sample was supplemented by new manufacturing establishments entering business in 2019-2021. The ASM was discontinued after the 2021 survey year.
Data items requested
The ASM data items requested included statistics on manufacturers’ employment, payroll, worker hours, payroll supplements, cost of materials, selected operating expenses, value added by manufacturing, capital expenditures, inventories, energy consumption, and products manufactured.
Key data items
Value of shipments and payroll were required to be counted as a response.
Type of request
Responses were required by law. Title 13 U.S.C., Sections 131 and 182, authorized this collection. Title 13 of the U.S.C., Sections 224 and 225, required responses.
Frequency and mode of contact
The ASM was conducted annually, except for years ending in 2 and 7, at which time ASM data were included in the manufacturing sector of the Economic Census.
Firms received a mailing with instructions to provide responses online via centurion. Due date and follow up mailings were also conducted during the collection period. Phone calls were also utilized to follow up with firms that had not responded, and data were also obtained in this manner.
Data collection unit
For all single-establishment firms and multi-establishment firms, the data collection unit was the establishment.
Special procedures
As noted in the Sample Design section, data for establishments included in the nonmail stratum were estimated using information obtained from the administrative records of the IRS and SSA; and were included in the published ASM estimates.
Compilation of Data
Editing
Data captured in the ASM were edited to identify and correct reporting errors. The data were also adjusted to account for missing items and for businesses that did not respond. Data edits detected and validated data by considering factors such as proper classification for a given record, historical reporting for the record, and industry/geographic ratios and averages.
The first step of the data editing process was classification. To assign a valid kind-of-business or industry classification code to the establishment, computer programs subjected the respondents’ responses to pre-specified items of a series of data edit programs. The specific items used for classification depended on the census report forms and included:
- Self-designated kind-of-business check-box classifications,
- Products manufactured by a plant, and
- Entries written in by the respondent explaining the establishment’s activities.
If critical information was missing, the record was flagged and fixed by analysts before further processing occurred. If all critical information was available, the classification code was assigned automatically. After classification codes were assigned, a "verification" operation was performed to validate the industry, geography and ZIP Codes.
After an establishment was assigned a valid industry code, the data edits further evaluated the response data for consistency and validity—for example, assuring that employment data were consistent with payroll or sales/receipts data. Response data was always evaluated by industry. Additional checks compared recently reported data to data reported in previous ASM or economic censuses or from administrative sources.
Nonresponse
Nonresponse is defined as the inability to obtain requested data from an eligible survey unit. Two types of nonresponse are often distinguished. Unit nonresponse is the inability to obtain any of the substantive measurements about a unit. In most cases of unit nonresponse, the Census Bureau was unable to obtain any information from the survey unit after several attempts to elicit a response. Item nonresponse occurs either when a question is unanswered or unusable.
Nonresponse adjustment and imputation
Nonresponse was handled by estimating or imputing missing data. Imputation is defined as the replacement of a missing or incorrectly reported item with another value derived from logical edits or statistical procedures.
The primary methods for imputing missing basic data items (such as receipts, sales, payroll, and employment) were:
- Using administrative data
- Deriving the missing data item from the establishment’s other data (either reported or administrative)
- Deriving the missing data item using prior ASM or economic census data
- Obtaining the information from another census survey
- Sampled establishments that did not report product data were assigned products in a hot-deck imputation process. In this process the products from a similar establishment (called the donor) were assigned to the establishment missing the product data (the recipient). For nonmail establishments, product data from the 2017 Economic Census was used when available.
Tabulation unit
The tabulation unit was the establishment.
Estimation
Most of the ASM estimates derived for the mail stratum were computed using a difference estimator. The difference estimator took advantage of the fact that, for manufacturing establishments, there was a strong correlation between the sample-year data values and the previous Census values. Because of this correlation, difference estimates were generally more reliable than comparable estimates developed from the sample data alone. The ASM difference estimates were computed at the establishment level by adding the weighted difference (between the current data and the Census data) to the Census data. That is,
Difference Estimate = Census value + weight (Current value - Census value)
Or equivalently
Difference Estimate = weight(Current value) + (1-weight)Census value
Estimates for the capital expenditures variables were not generated using the difference estimator because the year-to-year correlations were considerably weaker. The standard linear estimator was used for these variables.
For the nonmail stratum, estimates for payroll were directly tabulated from the administrative-record data provided by the IRS and the SSA. Estimates of the other data variables were developed from industry averages. Although the establishments in the nonmail stratum were far more numerous than those in the mail stratum, in 2019 they accounted for less than 6 percent of the value of shipments estimate at the total manufacturing level. In 2014, this accounted for 5 percent.
Corresponding estimates for the mail and nonmail components were combined to produce the estimates included in this publication.
Sampling Error
The sampling error of an estimate based on a sample survey is the difference between the estimate and the result that would be obtained from a complete census conducted under the same survey conditions. This error occurs because characteristics differ among sampling units in the population and only a subset of the population is measured in a sample survey. The particular sample used in this survey was one of a large number of samples of the same size that could have been selected using the same sample design. Because each unit in the sampling frame had a known probability of being selected into the sample, it was possible to estimate the sampling variability of the survey estimates.
Common measures of the variability among these estimates are the sampling variance, the standard error (SE), and the coefficient of variation (CV), which is also referred to as the relative standard error (RSE). The sampling variance is defined as the squared difference, averaged over all possible samples of the same size and design, between the estimator and its average value. The standard error is the square root of the sampling variance. The CV expresses the standard error as a percentage of the estimate to which it refers. For example, an estimate of 200 units that has an estimated standard error of 10 units has an estimated CV of 5 percent. The sampling variance, standard error, and CV of an estimate can be estimated from the selected sample because the sample was selected using probability sampling. Note that measures of sampling variability, such as the standard error and CV, are estimated from the sample and are also subject to sampling variability. It is also important to note that the standard error and CV only measure sampling variability. They do not measure any systematic biases in the estimates.
The Census Bureau recommends that individuals using these estimates incorporate sampling error information into their analyses, as this could affect the conclusions drawn from the estimates.
Estimates of the standard errors are computed from the sample data for selected ASM statistics in this report. They are represented in the form of relative standard errors (the standard error divided by the corresponding estimate). In conjunction with its associated estimate, the relative standard error may be used to define confidence intervals (ranges that would include the comparable, complete-coverage value for specified percentages of all the possible samples). The complete-coverage value would be included in the range:
An inference that the comparable, complete-survey result would be within the indicated ranges would be correct in approximately the relative frequencies shown. Those proportions, therefore, may be interpreted as defining the confidence that the estimates from a particular sample would differ from complete-coverage results by as much as one, two, or three standard errors, respectively.
For example, suppose an estimated total is shown as 50,000 with an associated relative standard error of 2 percent, that is, a standard error of 1,000 (2 percent of 50,000). There is approximately 67 percent confidence that the interval 49,000 to 51,000 includes the complete-coverage total, about 95 percent confidence that the interval 48,000 to 52,000 includes the complete-coverage total, and almost certain confidence that the interval 47,000 to 53,000 includes the complete-coverage total.
Confidence Interval
The sample estimate and an estimate of its standard error allow us to construct interval estimates with prescribed confidence that the interval includes the average result of all possible samples with the same size and design. To illustrate, if all possible samples were surveyed under essentially the same conditions, and an estimate and its standard error were calculated from each sample, then:
1. Approximately 68 percent of the intervals from one standard error below the estimate to one standard error above the estimate would include the average estimate derived from all possible samples.
2. Approximately 90 percent of the intervals from 1.645 standard errors below the estimate to 1.645 standard errors above the estimate would include the average estimate derived from all possible samples.
In the example above, the margin of error (MOE) associated with the 90 percent confidence interval is the product of 1.645 and the estimated standard error.
For example, the Number of Employees for Dog and Cat Food Manufacturing for 2018 was estimated by the sample to be 23,995, with an estimated RSE of 1%. Multiplying 23,995 by 1/100 produces an estimated SE of 240 employees. The lower bound of the confidence interval is 23,995 - 1.645*240 = 23,600 employees, and the upper bound of the confidence interval is 23.995 + 1.645*240 = 24,390 employees. Therefore, we are 90% confident that the Number of Employees for Dog and Cat Food Manufacturing for 2018 for the population is in the interval [23,600, 24,390], if this sampling process were repeated many times. It is important to note that the standard error and the relative standard error only measure sampling error. They do not measure any systematic nonsampling error in the estimates.
Nonsampling Error
Nonsampling error encompasses all factors other than sampling error that contribute to the total error associated with an estimate. This error may also be present in censuses and other nonsurvey programs. Nonsampling error arises from many sources: inability to obtain information on all units in the sample; response errors; differences in the interpretation of the questions, mismatches between sampling units and reporting units, requested data and data available or accessible in respondents’ records, or with regard to reference periods; mistakes in coding the data obtained; and other errors of collection, response, coverage, and processing.
In addition to the sampling errors, the estimates are subject to various response and operational errors: errors of collection, reporting, coding, imputation for nonresponse, etc. These nonsampling, or operational, errors also would occur if a complete canvass were to be conducted under the same conditions as the survey. Explicit measures of their effects generally are not available. However, it is believed that most of the important operational errors are detected and corrected during the Census Bureau’s review of the data for reasonableness and consistency. The small operational errors usually remain. To some extent, they are compensating in the aggregated totals shown. When important operational errors are detected too late to correct the estimates, the data are suppressed or are specifically qualified in the tables.
The total errors, which depend upon the joint effect of the sampling and nonsampling errors, are usually of the order of size indicated by the standard error, or moderately higher. However, for particular estimates, the total error may considerably exceed the standard errors shown. Any figures shown in the tables in this publication having an associated standard error exceeding 15 percent may be combined with higher level totals, creating a broader aggregate, which then may be of acceptable reliability.
The Census Bureau recommends that individuals using these estimates factor in this information when assessing their analyses of these data, as nonsampling error could affect the conclusions drawn from the estimates.
Response Rates
Two types of response rates were computed for the ASM: unit response rate (URR) and total quantity response rate (TQRR). The URR was the percentage of reporting units, based on unweighted counts, that were eligible (E) or of unknown eligibility (U) and were respondents (R) in the statistical period. Cases were assumed to be active and in scope in the absence of evidence otherwise. This included cases that were Undeliverable as Addressed. To be considered a respondent to the ASM, a reporting unit must have provided both of the key items: value of shipments and total payroll. The formula for calculating the URR is as follows: URR = [R/(E+U)] * 100. The URR for the past several ASM surveys were ranged from 53% to 58%. The last survey year in 2021 was 58%.
The TQRR is defined as the percentage of the estimated (weighted) item total that is obtained from directly reported data or from sources determined to be equivalent quality to reported data. The TQRR for value of shipments in the past several years was 58% to 68%. The TQRR for total payroll in the past several years was 69% to 74%. The last survey year in 2021, the TQRR was 68.06% for value of shipments, and 73.95% for total payroll.
Seasonal adjustment
N/A
Benchmarking
Benchmarking adjusts the level of a given series to the levels (referred to as benchmarks) from a less frequent data source that is considered to be of better quality, while attempting to minimize revisions to the period-to-period changes from the more frequent series. In this way, we produce consistent time series and attempt to reduce the effects of sampling and nonsampling errors in the original, more frequent series. For annual series in the Economic Directorate, such as the ASM, it is good statistical practice to benchmark the series to the Economic Census.
The published level estimates from the ASM play an important role in benchmarking the level estimates from the Manufacturers’ Shipments, Inventories, and Orders (M3) Survey. Also, the Bureau of Economic Analysis and the Federal Reserve Board utilize both the published levels and the year-to-year changes in producing modeled estimates. Because it is important that the estimates from the ASM be of the highest possible quality, published level estimates from the ASM have been benchmarked to published level estimates from the Economic Census - Manufacturing.
ASM estimates are benchmarked to the Economic Censuses by setting the ASM annual estimates equal to the census benchmarks in census years. The procedure then minimizes revisions to the original ASM estimates for years between the census benchmark years. The benchmarking methodology is as follows.
Let xt > 0 denote the originally published annual estimate for year t, yt > 0 denote the revised benchmarked annual estimate for year t, and ct > 0 denote the census benchmark for year t. The trend revision benchmarking methodology is an iterative procedure that attempts to minimize revisions to the year-to-year change while adjusting the annual levels, by finding a local minimum for the following function f and two constraints.
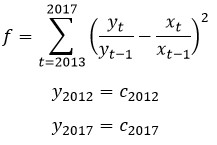
Using level estimates from the 2012 and 2017 Censuses of Manufactures as benchmarks, 2013-2016 ASM benchmark estimates were calculated for sixteen general statistics data items. For each of the general statistics items, the benchmark estimates were computed at the 6-digit NAICS level and then aggregated to the higher publication levels. Detail items (ex: inventory stages of fabrication), that are part of a published total item (ex: total inventories), were first benchmarked and then raked to the benchmarked total item. Value added was benchmarked indirectly by using its benchmarked component items. For the 2012 benchmarking, value of product shipments were benchmarked at the 7-digit ASM product class level. For 2017 benchmarking, due to NAPCS codes replacing product lines, there was no benchmarking done for NAPCS codes.
Duplication in Cost of Materials and Value of Shipments
Data for cost of materials and value of shipments include varying amounts of duplication, especially at higher levels of aggregation. This is because the products of one establishment may be the materials of another. The value added statistics avoid this duplication and are, for most purposes, the best measure for comparing the relative economic importance of industries and geographic areas.
Value of Industry Shipments Compared with Value of Product Shipments
The ASM shows value of shipments data for industries and products. In the industry statistics tables and files, these data represent the total value of shipments of all establishments classified in a particular industry. The data include the shipments of the products classified in the industry (primary to the industry), products classified in other industries (secondary to the industry), and miscellaneous receipts (resales, contract receipts, repair work, etc.). Value of product shipments shown in the products statistics tables and files represent the total value of all products shipped that are classified as primary to an industry regardless of the classification of the producing establishment.
Disclosure avoidance
Disclosure is the release of data that reveals information or permits deduction of information about a particular survey unit through the release of either tables or microdata. Disclosure avoidance is the process used to protect each survey unit’s identity and data from disclosure. Using disclosure avoidance procedures, the Census Bureau modifies or removes the characteristics that put information at risk of disclosure. Although it may appear that a table shows information about a specific survey unit, the Census Bureau has taken steps to disguise or suppress a unit’s data that may be “at risk” of disclosure while making sure the results are still useful.
Cell suppression is a disclosure avoidance technique that protects the confidentiality of individual survey units by withholding cell values from release and replacing the cell value with a symbol, usually a “D”. If the suppressed cell value were known, it would allow one to estimate an individual survey unit’s response too closely.
The cells that must be protected are called primary suppressions.
To make sure the cell values of the primary suppressions cannot be closely estimated by using other published cell values, additional cells may also be suppressed. These additional suppressed cells are called complementary suppressions.
The process of suppression does not usually change the higher-level totals. Values for cells that are not suppressed remain unchanged. Before the Census Bureau releases data, computer programs and analysts ensure primary and complementary suppressions have been correctly applied.
In accordance with federal law governing census reports (Title 13 of the United States Code), no data are published that would disclose the operations of an individual establishment or company. Additional information on the techniques employed to limit disclosure in the Census Bureau’s economic surveys are discussed at: https://www.census.gov/programs-surveys/economic-census/technical-documentation/methodology/disclosure.html
Disclosure analysis is performed at the field level, i.e., disclosure analysis performed for each variable independent of other variables for that NAICS-based industry or product class. When data for a NAICS-based industry or product class are suppressed, these data still are included in higher-level totals.
The Census Bureau has reviewed this data product to ensure appropriate access, use, and disclosure avoidance protection of the confidential source data (Project No. P-7500114, Disclosure Review Board (DRB) approval numbers: CBDRB-FY23-086, CBDRB-FY22-063, CBDRB-FY21-107, and CBDRB-FY20-231).
For more information on disclosure avoidance practices, see FCSM Statistical Policy Working Paper 22.