
Official websites use .gov
A .gov website belongs to an official government organization in the United States.
Secure .gov websites use HTTPS
A lock (
) or https:// means you’ve safely connected to the .gov website. Share sensitive information only on official, secure websites.

Topics
Data & Maps
Surveys & Programs
Resource Library
Annual Business Survey Methodology 2017 (Employer Businesses)
Annual Business Survey Methodology 2017 (Employer Businesses)
The Annual Business Survey (ABS) provides information on selected economic and demographic characteristics for businesses and business owners by sex, ethnicity, race, and veteran status. The survey also measures research and development (R&D) for microbusinesses, business topics such as innovation and technology, as well as other business characteristics. The ABS is conducted jointly by the U.S. Census Bureau and the National Center for Science and Engineering Statistics (NCSES) within the National Science Foundation. The ABS replaces the five-year Survey of Business Owners (SBO) for employer businesses, the Annual Survey of Entrepreneurs (ASE), the Business R&D and Innovation Survey for Microbusinesses (BRDI-M), and the Innovation section of the Business R&D and Innovation Survey (BRDI-S).
Title 13, United States Code, Sections 8(b), 131, and 182, Title 42, United States Code, Section 1861-76 (National Science Foundation Act of 1950, as amended), and Section 505 within the America COMPETES Reauthorization Act of 2010, authorize this collection. Sections 224 and 225 of Title 13 require mandatory response.
The Annual Business Survey uses the collection year (the year the survey was collected) in the survey name rather than the reference year (the year the survey collects data on). This is in an effort to better reflect the collection cycle of the survey. The 2018 ABS, for example, covers reference year 2017.
This methodology specifically reports on the Company Summary, Characteristics of Businesses, and Characteristics of Business Owners tables for the ABS.
Sources of the Data
Annual Business Survey data are sourced from a combination of responses to the survey, data from the economic census, and administrative records data. The ABS is primarily collected using an electronic instrument. The survey was mailed to approximately 850,000 employer businesses. Businesses selected to report were sent a letter informing of their requirement to report. The letter also provided instructions on how to access the survey and submit online. A random sample of employer businesses was selected from a list of all firms operating during the reference year with receipts of $1,000 or more except those classified in the following NAICS industries:
Crop and Animal Production (NAICS 111 and 112)
Rail Transportation (NAICS 482)
Postal Service (NAICS 491)
Monetary Authorities-Central Bank (NAICS 521)
Funds, Trusts, and Other Financial Vehicles (NAICS 525)
Religious, Grantmaking, Civic, Professional, and Similar Organizations (NAICS 813)
Private Households (NAICS 814)
Public Administration (NAICS 92)
The list of all firms (or universe) was compiled from a combination of business tax returns and data collected on other economic surveys.
Content for the ABS was developed using previous surveys collected by the Census Bureau. Additionally, the expertise provided by the NCSES resulted in the expanded collection of data on R&D for microbusinesses, innovation, and technology. The Census Bureau regularly collaborates with NCSES to develop a new module of questions for each survey year based on relevant economic topics. A summary of the modules selected for the ABS is shown below.
Survey Year |
Module Content Topic(s) |
2018 ABS |
· Financing |
The information collection maximized response by incorporating the following methods:
Mailing materials that emphasize the mandatory and confidential nature of census surveys, as provided by Title 13, United States Code;
Designing effective electronic reporting instruments and instructions;
Allowing respondents to preview the survey to assist with data gathering prior to completing in the electronic instrument;
Offering a toll-free telephone number for companies with questions or that needed assistance in completing the electronic survey;
Conducting systematic mail and email follow-ups to nonrespondents;
Conducting a nonresponse bias analysis if unit response falls below 60 percent.
Questionnaires and Instructions
Prior to tabulating the data, response data were reviewed and edited to correct reporting errors. An automated data edit system was used to review the data for reasonableness and consistency. The editing process interactively performed corrections by using standard procedures to fix detectable errors. Quality control techniques were used to verify that operations, processes, and methods were carried out as specified.![]()
Basis of Reporting
The ABS is conducted on a company or firm basis rather than an establishment basis. A company or firm is a business consisting of one or more domestic establishments under its ownership or control. One report is collected from each company or firm, and administrative records of the establishments that make up the firm are used to assign the company to different tabulation categories.
Industry Classification of Firms
The industry classifications of firms are based on the 2017 North American Industry Classification System (NAICS). Firms with more than one domestic establishment are counted in each industry and geographic area in which they operate, but only once in the total for all sectors and the totals at the national and other geography levels. The primary source of industry classification is derived from data collected through the economic census or through other Census Bureau surveys. When this is not available, the Census Bureau uses a hierarchy of administrative record sources to assign a NAICS code, including classifications from the Bureau of Labor Statistics, business birth information, and self-assigned codes from income tax records.
Sampling and Estimation Methodologies
Sampling. Due to time constraints on the availability of administrative data, the ABS sampling universe was created using Business Register administrative data from the year prior to the survey year. The Business Register is the Census Bureau’s comprehensive database of U.S. businesses, and its data are compiled from a combination of business tax returns, data collected from the economic census, and data from other Census Bureau surveys. The Business Register includes sole proprietorships, partnerships, and corporations reporting business activity to the Internal Revenue Service (IRS) on any one of the following IRS tax forms: 1040 (Schedule C), “Profit or Loss from Business” (Sole Proprietorship); 1065, “U.S. Return of Partnership Income”; 941, “Employer’s Quarterly Federal Tax Return”; 944, “Employer’s Annual Federal Tax Return”; or any one of the 1120 corporate tax forms. During ABS universe construction, information on industry classification, receipts, payroll and employment was extracted from the Business Register.
The Census Bureau uses the following sources of information to estimate the probability that a business was minority- or women-owned:
- Administrative data from the Social Security Administration
- Lists of minority- and women-owned businesses published in syndicated magazines, located on the Internet, or disseminated by trade or special interest groups
- Word strings in the company name indicating possible minority ownership (derived from 2012 survey responses)
- Racial distributions for various state-industry classes (derived from 2012 survey responses) and racial distributions for various ZIP Codes
- Sex, ethnicity, race, and veteran status responses of a single-owner business to a previous SBO, a previous ASE, a previous American Community Survey (ACS), or the 2010 Decennial Census
These probabilities were then used to place each firm in the ABS universe in one of nine frames for sampling:
- American Indian and Alaska Native
- Asian
- Black or African American
- Hispanic
- Non-Hispanic White Men
- Native Hawaiian and Other Pacific Islander
- Other
- Publicly owned
- Women
The ABS universe is stratified by state, frame, and industry. Large companies were selected with certainty based on volume of sales, payroll, or number of paid employees. Specifically for the 2018 ABS, firms were selected with certainty based on the following criteria: firms with more than 500 employees; firms classified in industry 5417; and firms larger than stratum specific payroll and receipt cut-offs. All certainty cases are sure to be selected and represent only themselves. Thus, certainty cases have a selection probability of one and a sampling weight of one. The certainty cutoffs vary by sampling stratum, depending on the number and size of firms in a particular stratum. The remaining universe is subjected to stratified systematic random sampling.
Each firm selected into the sample was asked to report their percentage of ownership, as well as the sex, ethnicity, race, and veteran status for up to four persons owning the largest percentages in the business. These firms were then asked additional owner and business characteristic questions (e.g., age of owner, education level, sources of business funding). Additionally, all firms were asked to provide information on the business’s technology, innovations, and innovation activities (patents, intellectual property, digital share of business activity, cloud service purchases, business technologies). Firms with less than 10 W-2 employees were asked to provide information on their research and development expenses.
Tabulation. Tabulations were produced for the final estimates and are available through data.census.gov, the Census Bureau's online, self-service data access tool; and the Census API, an external application programming interface that allows developers to work directly with the tabulated data.
Data are tabulated by the sex, ethnicity, race, and veteran status of the firm owners. Business ownership is defined as having 51 percent or more of the stock or equity in the business and is categorized by firms classifiable by sex, ethnicity, race, and veteran status and firms unclassifiable by sex, ethnicity, race, and veteran status.
Firms classifiable by sex, ethnicity, race, and veteran status are categorized by the following:
Sex
Female
Male
Equally male/female
Ethnicity
Hispanic
- Mexican, Mexican American, Chicano
- Puerto Rican
- Cuban
- Other Hispanic, Latino, or Spanish origin
- Non-Hispanic
- Equally Hispanic/non-Hispanic
- Race
- White
- Black or African American
- American Indian and Alaska Native
- Asian
- Asian Indian
- Chinese
- Filipino
- Japanese
- Korean
- Vietnamese
- Other Asian
- Native Hawaiian and Other Pacific Islander
- Native Hawaiian
- Samoan
- Guamanian or Chamorro
- Other Pacific Islander
- Minority
- Firms classified as any race and ethnicity combination other than non-Hispanic and White
- Nonminority
- Firms classified as non-Hispanic and White
- Equally minority/nonminority
- Veteran status
- Veteran
- Nonveteran
- Equally veteran/nonveteran
Firms unclassifiable by sex, ethnicity, race, and veteran status include firms that have no owners with a 10% or greater ownership of the stock or equity in the business.
Businesses could be tabulated in more than one racial group. This can result because:
- The sole owner was reported to be of more than one race.
- The majority owner was reported to be of more than one race.
- A majority combination of owners was reported to be of more than one race.
The detail may not add to the total or subgroup total because a Hispanic or Latino firm may be of any race, and because a firm could be tabulated in more than one racial group. For example, if a firm responded as both Chinese and Black majority owned, the firm would be included in the detailed Asian and Black estimates, but would only be counted once toward the higher-level Asian and “Total of All Firms” estimates.
For the tabulations by sex, ethnicity, race, and veteran status, the data for each firm in the ABS sample were weighted by the reciprocal of the firm's probability of selection.
It is important to note that while a business’s eligibility to enter the sample and be included in tabulations was determined using administrative data from the year prior to the survey year, the actual tabulations use administrative data from the survey year whenever they are available. This was done due to time constraints on the availability of administrative data. This can result in unexpected results such as businesses being classified as employers while having zero payroll and employment.
Reliability of Estimates
The figures shown in these datasets are, in part, estimated from a sample and will differ from the figures that would have been obtained from a complete census. Two types of errors are associated with estimates based on data from a sampled survey: sampling errors and nonsampling errors. The accuracy of the data depends on both measureable sampling errors and unmeasurable nonsampling errors. For particular estimates, the total error may considerably exceed the measured error. The following is a description of the sampling and nonsampling errors associated with the ABS tabulation.
Sampling Variability. The specific sample selected in a survey year is only one of many in a large number of all possible samples which could have been selected using the same sample design. Estimates derived from the different samples would differ from each other. The relative standard error and standard error are measures of the variability among the estimates from all possible samples. The estimated relative standard errors and estimated standard errors presented in the tables estimate the sampling variability, and thus measure the precision with which an estimate from the particular sample selected for this survey approximates the average result of all possible samples. Relative standard errors and standard errors are applicable only to those published cells in which sample cases are tabulated. A relative standard error is an expression of the standard error as a percent of the quantity being estimated.
The sampled estimate and its relative standard error can be used to approximate the true standard error, and then construct interval estimates with a prescribed level of confidence that the average result of all potential samples is included in the interval. To illustrate, if all possible samples were surveyed under essentially the same conditions, and estimates are calculated from each sample, then:
- Approximately 68 percent of the intervals from one standard error below to one standard error above the estimate would include the average value of all possible samples.
- Approximately 90 percent of the intervals from 1.6 standard errors below to 1.6 standard errors above the estimate would include the average value of all possible samples.
Thus, for a particular sample, one can say with specified confidence that the average of all possible samples is included in the constructed interval.
Example of a confidence interval. Suppose the estimate is 51,707 and the estimated relative standard error is 2 percent. The standard error is then 2 percent of 51,707 or 1,034. An approximate 90-percent confidence interval is found by first multiplying the standard error by 1.6 and then adding and subtracting that result from the estimate to obtain the upper and lower bounds. Since 1.6 x 1,034 = 1,654, the confidence interval in this example is 51,707 + or - 1,654 or the range 50,053 to 53,361.
For the Characteristics of Businesses and Characteristics of Business Owners datasets, some data are expressed as percentages with standard errors rather than relative standard errors as indicated above. Construction of the confidence interval is illustrated by the following example:
Example of a confidence interval for percentage data. Suppose the estimate is 76.9 and the estimated standard error is 0.4 percent. An approximate 90-percent confidence interval is found by first multiplying the standard error by 1.6 and then adding and subtracting that result from the estimate to obtain the upper and lower bounds. Since 1.6 x 0.4 = 0.64, the confidence interval in this example is 76.9 + or - 0.64 or the range 76.26 to 77.54.
Nonsampling Errors. All surveys and censuses are subject to nonsampling errors. Nonsampling errors are attributed to various sources: inability to identify all cases that should be in the universe; inability to obtain information for all cases in the universe; imputation for missing data; definition and classification difficulties; data errors and biases; errors in recording or coding the data obtained; and other errors of coverage, processing, and estimation for missing or misreported data.
While explicit measures of the effects of these nonsampling errors are not available, adjustments are made to the published relative standard errors to account for errors associated with imputation of missing data. The Census Bureau makes every effort to detect and correct important operational and data errors during processing, editing, analysis, and estimation phases of the survey life cycle.
Unpublished Estimates. Some unpublished estimates can be derived directly from datasets by subtracting published estimates from their respective totals. However, the results obtained by such subtraction would be subject to poor response, high sampling variability, or other factors that may make the results misleading. Individuals who use such calculations in datasets to create new estimates should cite the Census Bureau as the source of the original estimates only.
Precautions in Analyzing and Interpreting Data
All survey and census results contain measurement errors and may contain sampling errors. Information about these potential errors is provided or referenced with the data. The Census Bureau recommends that data users incorporate this information into their analyses as these errors could impact inferences. Researchers analyzing data to create their own estimates are responsible for the validity of those estimates and should only cite the Census Bureau as the source of the core data.
Treatment of Nonresponse
Approximately 67.8 percent of the sample responded to the survey. For approximately 4 percent of businesses, a questionnaire was submitted but did not contain enough information to be considered a response to estimate ownership by sex, ethnicity, race, and veteran status.
Historical data and imputation methods were used to adjust for nonresponse. If available, historical data from related programs (2016 ASE, 2015 ASE, 2014 ASE, or 2012 SBO), were substituted for missing data to determine the sex, ethnicity, race, and veteran status of the business owner or majority business owners (approximately 16.1 percent of nonrespondents).
When historical data were not available, the sex, ethnicity, race and veteran status were imputed from donor respondents in the same sampling frame with similar characteristics (industry, legal form of organization, geography). Donor imputations are considered reliable because sampling frame assignments are based on administrative data which have a high level of agreement with the tabulated race and ethnicity for responding firms. Sampling variability estimates are adjusted to account for nonresponse. Estimates with high errors of 50 percent or more are suppressed because they do not meet publication standards. Overall, imputed data accounted for approximately 27.9 percent of the firm count estimates by sex, ethnicity, race, and veteran status and approximately 34.6 percent of the receipts estimates.
Disclosure
Confidentiality. In accordance with United States Code, Title 13, Section 9, no data are published that would disclose the operations of an individual establishment or business. Data obtained from the Internal Revenue Service, the Social Security Administration, and other sources are also treated as confidential and can be seen only by Census Bureau employees sworn to protect the data from disclosure.
Disclosure Avoidance. Disclosure avoidance is the process used to protect the confidentiality of the survey data provided by an individual or firm. Using disclosure avoidance procedures, the Census Bureau modifies or removes the characteristics which may disclose confidential information. Although it may appear that a table shows information about a specific individual or business, the Census Bureau has taken steps to mask or suppress the original data while making sure the results are still useful.
The Census Bureau has reviewed this data product for unauthorized disclosure of confidential information and has approved the disclosure avoidance practices applied (Approval ID: CBDRB-FY20-008).
Noise Infusion. The ABS uses noise infusion as the primary method of disclosure avoidance. Noise infusion perturbs data values prior to tabulation by applying a random noise multiplier to the magnitude data, such as the sales and receipts for all firms. Disclosure protection is accomplished in a manner that causes the vast majority of cell values to be perturbed by, at most, a few percentage points. For sample-based tabulations, such as ABS, the estimated relative standard error for a published cell includes both the estimated sampling error and the amount of perturbation in the estimated cell value due to noise.
In certain circumstances, some individual cells may be suppressed for additional disclosure avoidance. Suppressed data are replaced by one of the following symbols:
- N - Not available or not comparable
- S - Withheld because estimates did not meet publication standards, such as the relative standard error of the sales is 50 percent or more
- X - Not applicable
To provide meaningful information for cells that have suppression of sensitive employment data, the following symbols are used to indicate the employment range for a firm:
- a - 0 to 19 employees
- b - 20 to 99 employees
- c - 100 to 249 employees
- e - 250 to 499 employees
- f - 500 to 999 employees
- g - 1,000 to 2,499 employees
- h - 2,500 to 4,999 employees
- i - 5,000 to 9,999 employees
- j - 10,000 to 24,999 employees
- k - 25,000 to 49,999 employees
- l - 50,000 to 99,999 employees
- m - 100,000 employees or more
For a complete list of economic program symbols, see the Symbols Glossary.
Firm Size and Years in Business Categories
The firm size categories, both by receipts and employment, are based on the total nationwide receipts and/or employment of the firm.
The receipts size and employment size of a multi-unit firm are determined by the summed revenue or employment of all associated establishments. The employment size group "0 employees" includes firms for which no associated establishments reported paid employees in the March 12 pay period, but paid employees at some time during the year.
Receipts size and employment size are determined for the entire company. Hence, counterintuitive results are possible. For example, only 100 employees in a category of firms with 500 employees or more in a particular industry. The remaining employees in the firm employment size are tabulated in other industries.
Data by receipts size of firm are presented by the following receipts size categories:
All firms
Firms with sales/receipts of less than $10,000
Firms with sales/receipts of $10,000 to $49,999
Firms with sales/receipts of $50,000 to $99,999
Firms with sales/receipts of $100,000 to $249,999
Firms with sales/receipts of $250,000 to $499,999
Firms with sales/receipts of $500,000 to $999,999
Firms with sales/receipts of $1,000,000 or more
Data by employment size of firm are presented by the following employment size categories:
All firms
Firms with no employees
Firms with 1 to 4 employees
Firms with 5 to 9 employees
Firms with 10 to 19 employees
Firms with 20 to 49 employees
Firms with 50 to 99 employees
Firms with 100 to 249 employees
Firms with 250 to 499 employees
Firms with 500 or more employees
Employer firms include firms with payroll at any time during the survey year. The employment size of firms, however, is specifically determined by the number of paid employees during the March 12 pay period of the survey year.
Data are also categorized by the firm’s number of years in business, which is determined by the first year that the Census Bureau received administrative records data for the business. Data by years in business are presented by the following years in business categories:
All firms
Firms with less than 2 years in business
Firms with 2 to 3 years in business
Firms with 4 to 5 years in business
Firms with 6 to 10 years in business
Firms with 11 to 15 years in business
Firms with 16 or more years in business
Exclusion of Nonemployer Businesses
The Annual Business Survey excludes the collection of data from nonemployer businesses. The Census Bureau has determined that similar estimates on owner demographics for nonemployer businesses can be produced using administrative records data. As a result, a research project known as the Nonemployer Statistics by Demographics series (NES-D) has been developed to produce nonemployer demographic data by sex, ethnicity, race, veteran status, owner age, and place of birth. For more information on the NES-D, visit the Guidance for Data Users page.
Comparability to Other Surveys
Data from the Annual Business Survey may not be fully comparable with previous surveys. Receipts, payroll and employment figures are derived from administrative sources and may not be directly comparable to the values reported in other surveys. Currently, the ABS collects receipts data to evaluate the accuracy as compared to data collected from other Census Bureau surveys, including the economic census. For the 2018 ABS, receipts estimates are derived from the economic census and not the collected receipts.
Caution should be exercised when making any comparisons between ABS and other economic surveys.
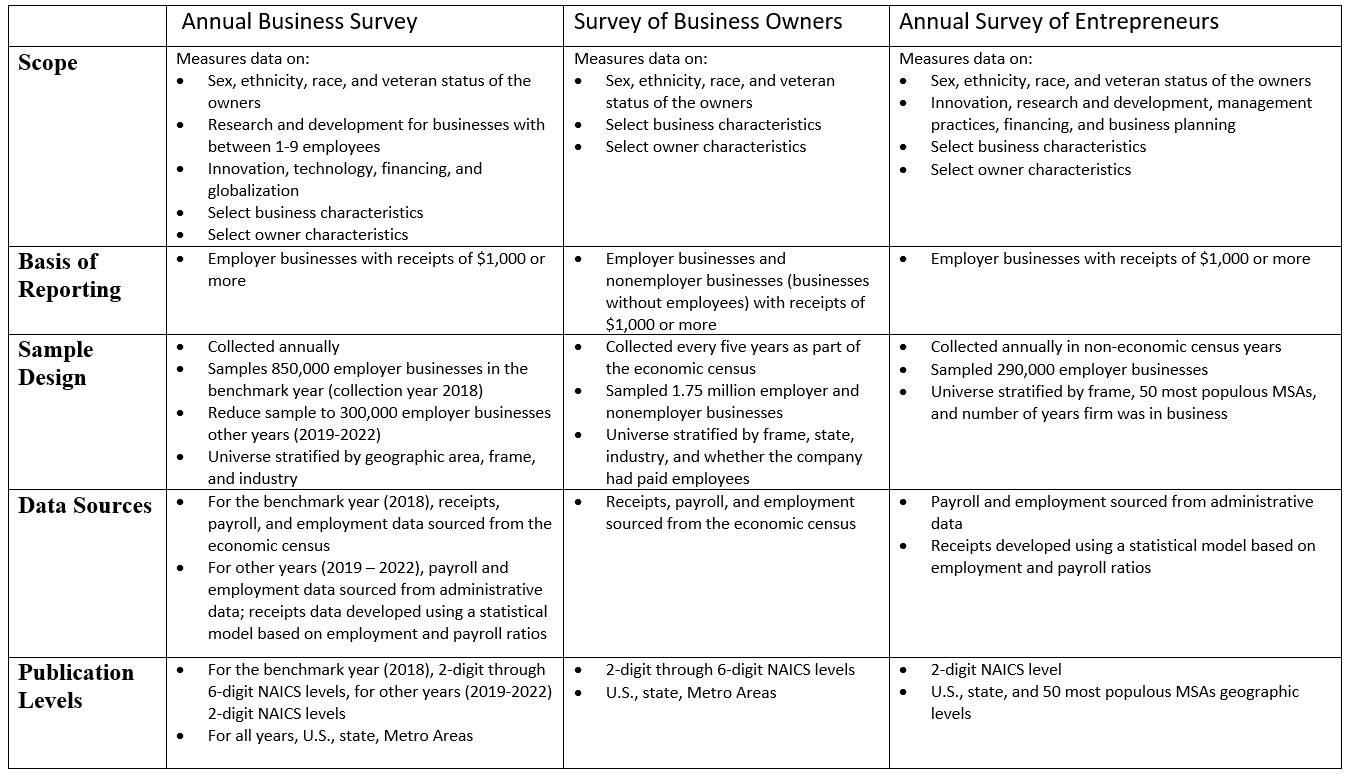
Comparability to the Survey of Business Owners and the Annual Survey of Entrepreneurs
The ABS replaces the Survey of Business Owners (SBO) and Annual Survey of Entrepreneurs (ASE). However, there are differences between the programs that affect comparability. The ABS program scope is slightly different and therefore, different methodologies are used to produce data by sex, ethnicity, race, and veteran status.
Additionally, the ABS sample is designed to collect data on research and development (for microbusinesses), innovation, technology, and various other business characteristics.
At-a-Glance: ABS, SBO, and ASE
Click to enlarge
Comparability to the Business Enterprise Research and Development Survey and the Business R&D and Innovation Survey for Microbusinesses
The Business Enterprise Research and Development Survey (BERD) is sponsored by the NCSES and collects information on financial measures of R&D activity, measures related to R&D employment, and measures related to R&D management and strategy. The survey samples approximately 45,000 companies with 10 or more employees. R&D data are collected on both the ABS and the BERD surveys. However, the R&D module on the ABS is only collected from businesses with 1-9 reported employees.
The ABS replaces the Business R&D and Innovation Survey for Microbusinesses (BRDI-M). The survey was previously collected as part of the Business R&D and Innovation Survey (currently renamed to BERD) from small businesses with 1-9 employees. The survey was fielded for one reference year before merging into the ABS. Similar data are available from the ABS.
Comparability to the Business Dynamics Statistics
The Business Dynamics Survey (BDS) provides a longitudinal source of data on businesses which can be tracked over many years. The BDS compiles data from the entire set of private nonfarm employer businesses in the Longitudinal Business Database (LBD). Both the BDS and the ABS provide statistics by firm age (number of years in business). The BDS measures firm age using information from the LBD, which links annual snapshot files from Census Bureau's Business Register (BR) to provide a history for each establishment. More information on the linkage process is available on the BDS website. The ABS measures firm age based on the initial year the business was available from the BR. The age of a firm may differ based on which method is used.
Page Last Revised - November 14, 2023
✕
Is this page helpful?
 Yes
Yes
 No
No
 Yes
Yes
 No
No✕
NO THANKS
255 characters maximum
 255 characters maximum reached
✕
Thank you for your feedback.
Comments or suggestions?

Comments or suggestions?