
Official websites use .gov
A .gov website belongs to an official government organization in the United States.
Secure .gov websites use HTTPS
A lock (
) or https:// means you’ve safely connected to the .gov website. Share sensitive information only on official, secure websites.

Topics
Data & Maps
Surveys & Programs
Resource Library
National Hot Tea Month: January 2024
National Hot Tea Month: January 2024
Press Release Number CB24-SFS.002
According to the Tea Association of the U.S.A., Inc., Tea Fact Sheet - 2022:
“Tea is the most widely consumed beverage in the world next to water, and can be found in almost 80% of all U.S. households. It is the only beverage commonly served hot or iced, anytime, anywhere, for any occasion. On any given day, over 159 million Americans are drinking tea.
“Annual Consumption: In 2021, Americans consumed almost 85 billion servings of tea, or more than 3.9 billion gallons. About 84% of all tea consumed was black tea, 15% was green tea, and the small remaining amount was oolong, white and dark tea…
“Daily Consumption: On any given day, more than one half of the American population drinks tea. On a regional basis, the South and Northeast have the greatest concentration of tea drinkers.”

Key Stats
From Census.gov > Business and Economy > International Trade Data:

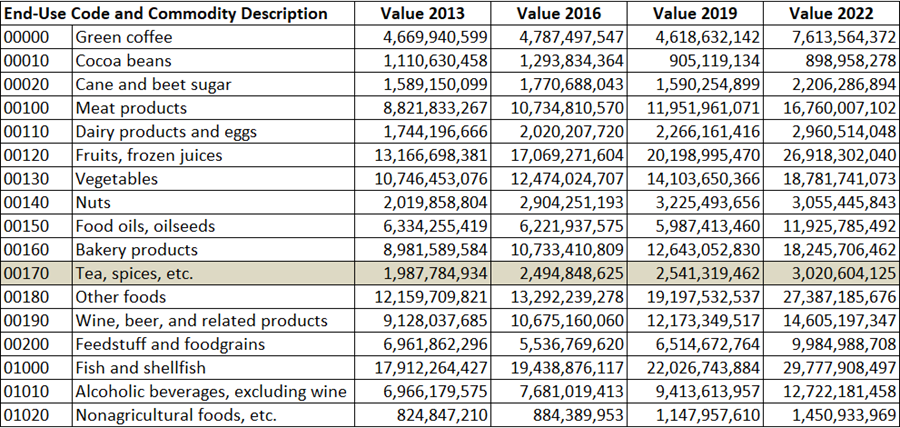
Note: The table above is modified to hide columns for years 2014, 2015, 2017, 2018, 2020 and 2021 to make it more readable here. Click on the image for the full Excel table including many rows below 01020 Nonagricutural foods, etc.
More Stats
From Census.gov > Business and Economy > International Trade Data:

Note: After you create an account, select options for State Export Data (Origin of Movement) or State Import Data (State of Destination) by Harmonized System (HS) or NAICS. Select State, Measures, Commodity (search for tea), Country, or Time for data. More information can be found in the Quick Start Guide. For guidance on searching USA Trade Online, check out this video: DATA GEM: Learn How to Easily Find Export and Import Data With USA Trade Online.
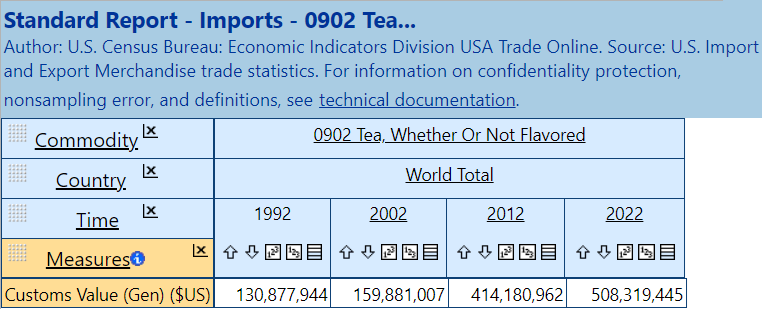
For example: Pictured below are the results of a search for U.S. imports of commodity 0902 Tea, Whether Or Not Flavored; country, the world; time, 1992, 2002, 2012 and 2022; and measure, Customs Value (General Imports) in $US. In summary, the U.S. imported $508 million of tea, whether or not flavored, from the world in 2022.
Source: 2021 County Business Patterns (CBP)

Source: 2018 - 2021 Annual Survey of Manufactures (ASM)
- NAICS Sector 31-33, Manufacturing
- NAICS 311, Food Manufacturing
- NAICS 3119, Other Food Manufacturing
- NAICS 311920, Coffee and Tea Manufacturing
Source: 2017 Economic Census
Outside Links
Page Last Revised - December 28, 2023
✕
Is this page helpful?
 Yes
Yes
 No
No
 Yes
Yes
 No
No✕
NO THANKS
255 characters maximum
 255 characters maximum reached
✕
Thank you for your feedback.
Comments or suggestions?

Comments or suggestions?