For Immediate Release: Tuesday, December 19, 2023
U.S. Population Trends Return to Pre-Pandemic Norms as More States Gain Population
DEC. 19 — Population trends are returning to pre-pandemic norms as the number of annual deaths decreased last year and migration reverted to patterns not seen since before 2020, according to the new Vintage 2023 population estimates released today by the U.S. Census Bureau.
The nation gained more than 1.6 million people this past year, growing by 0.5% to 334,914,895. More states experienced population growth in 2023 than in any year since the start of the pandemic.
This year’s national population growth is still historically low but is a slight uptick from the 0.4% increase in 2022 and the 0.2% increase in 2021.
“U.S. migration returning to pre-pandemic levels and a drop in deaths are driving the nation’s growth,” said Kristie Wilder, a demographer in the Population Division at the Census Bureau. “Although births declined, this was tempered by the near 9% decrease in deaths. Ultimately, fewer deaths paired with rebounding immigration resulted in the nation experiencing its largest population gain since 2018.”
The South Drives Nation’s Population Growth
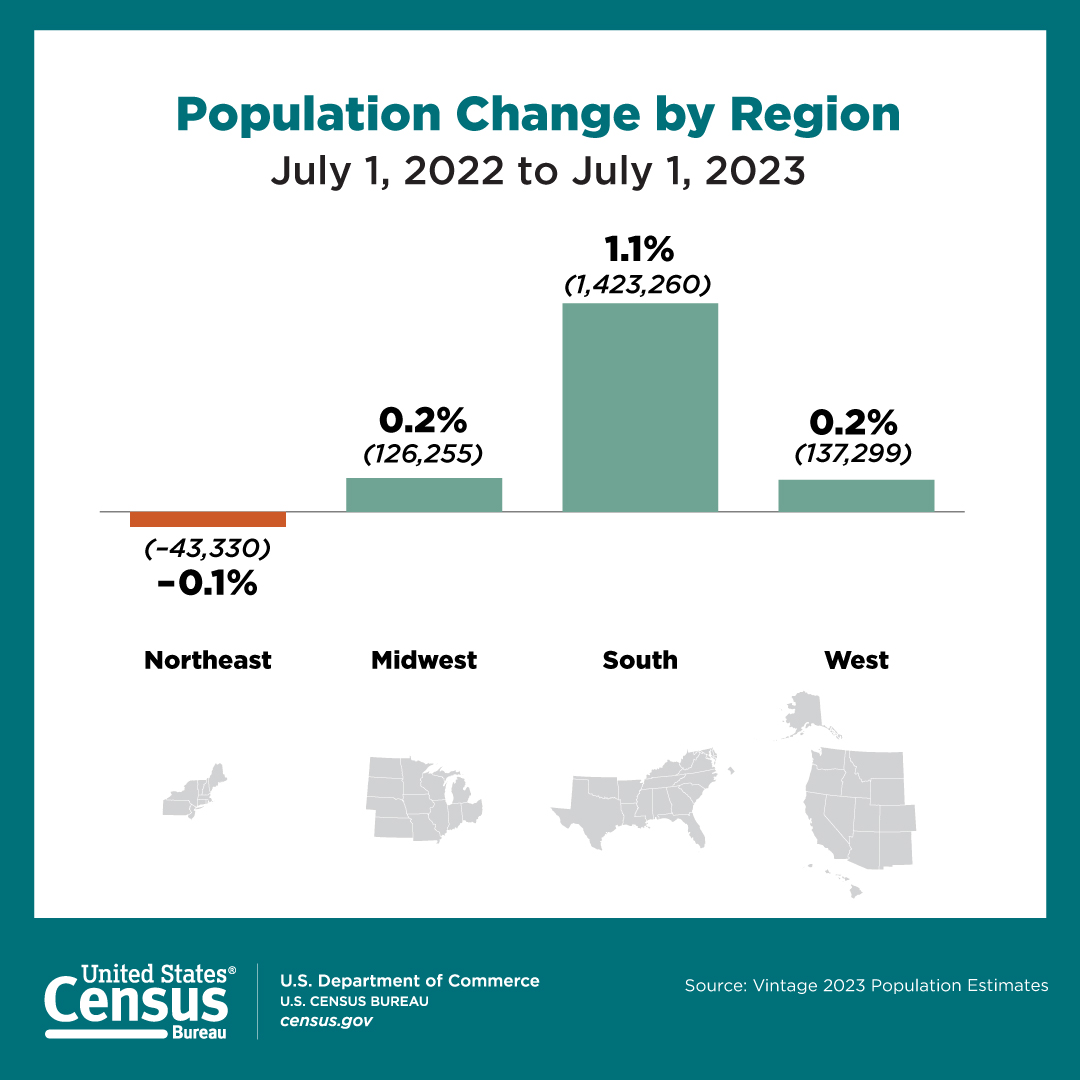
The expansion of the South — the nation’s most populous region — accounted for 87% of the nation’s growth in 2023, as the region added over 1.4 million residents for a total population of 130,125,290. The South is the only region to have maintained population growth throughout the COVID-19 pandemic. The growth in 2023 can largely be attributed to the region’s migration patterns as 706,266 people were added via net domestic migration, while net international migration contributed almost 500,000 to the total.
After two consecutive years of decline, the population in the Midwest had a moderate gain of 0.2%, or just over 126,000 residents. The Midwest’s population rebounded due to a lower rate of outmigration to other regions, increased international migration, a slowdown in population loss in Illinois, and growth in Indiana, Minnesota and Ohio.
The West also expanded, with 137,299 people added to the region, slightly lower than the 157,480 people added in 2022. Somewhat higher international migration and slightly fewer deaths were offset by higher outmigration to other regions. Fewer Western states experienced population loss in 2023, with Alaska and New Mexico gaining population again after losing population the prior year. California, Oregon and Hawaii continued to lose population but at a more modest pace than the prior year.
The Northeast’s population declined in 2023, down 43,330, but the loss was considerably smaller than the 216,576 decline in 2022 or the 187,054 decline in 2021, reflecting substantially less outmigration to other regions. New York and Pennsylvania were the only Northeastern states to lose population in 2023 but the declines were considerably reduced from the prior year.
More States Gaining Population
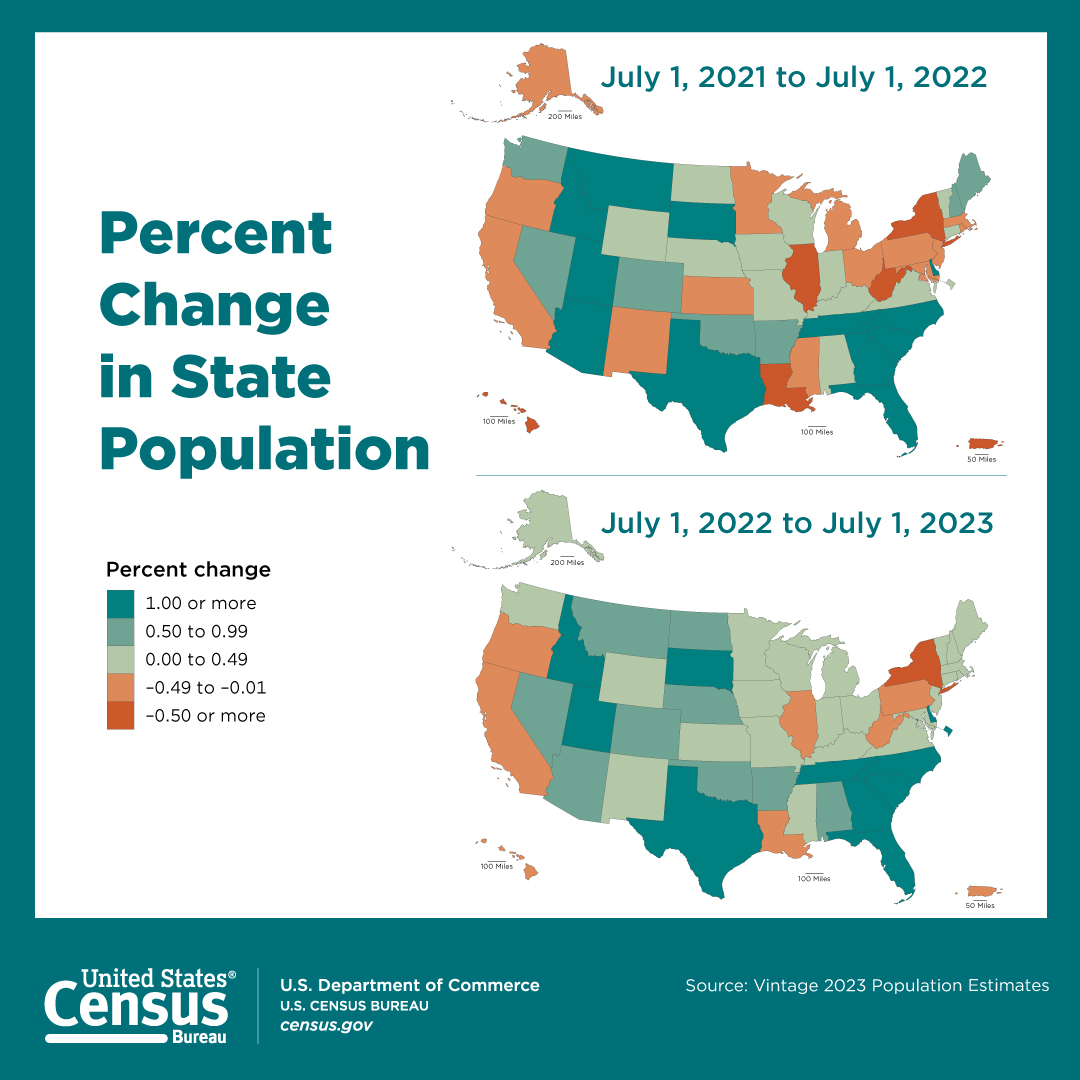
In 2023, more states gained population than has been seen since the start of the pandemic. At the state level, 42 states and the District of Columbia had an increase in population, up from 31 states and the District of Columbia in 2022 and 34 states in 2021. The increasing number of states with population growth reflects both the broad national trends of deaths and net international migration returning to pre-COVID levels as well as reduced net domestic outmigration for some of the states.
Eleven states that lost population in 2022 are now seeing gains: New Jersey (30,024), Ohio (26,238), Minnesota (23,615), Massachusetts (18,659), Maryland (16,272), Michigan (3,980), Kansas (3,830), Rhode Island (2,120), New Mexico (895), Mississippi (762), and Alaska (130).
Eight states saw their population fall in 2023: California (-75,423), Hawaii (-4,261), Illinois (-32,826), Louisiana (-14,274), New York (-101,984), Oregon (-6,021), Pennsylvania (-10,408), and West Virginia
(-3,964). Collectively, these states had a population loss of 249,161 in 2023, compared to a loss of 509,789 in 2022. While many of these states have lost population annually since 2020, their population declines have slowed.
As more states experience population growth, that growth is no longer concentrated in only a few states. For example, four southern states — Texas, Florida, North Carolina and Georgia — accounted for 93% of the nation’s population growth in 2022, but only 67% in 2023.
Texas experienced the largest numeric change in the nation, adding 473,453 people, followed by Florida, which added 365,205 residents. South Carolina and Florida were the two fastest-growing states in the nation, growing by 1.7% and 1.6%, respectively, in 2023.
Georgia also reached a new population threshold as the state’s population exceeded 11 million people in 2023, increasing by 116,077 to a total population of 11,029,227.
Refer to the bottom of the release for tables on the Top 10 Most Populous States: 2023, Top 10 States by Numeric Growth: 2022 to 2023, and Top 10 States or State Equivalent by Percent Growth: 2022 to 2023.
Puerto Rico’s Population Decline Slows
The population in Puerto Rico was 3,205,691 in 2023, continuing the trend of population decline for the U.S. territory. However, the rate of population decline has slowed, with a loss of 0.4%, or 14,422 people, in 2023 compared to a loss of 1.3%, or 42,580 people, in 2022.
Puerto Rico had its first year of positive net migration since the onset of the COVID-19 pandemic, adding 1,872 people via migration in 2023.
Meanwhile, births declined by 4.5% and deaths increased by 2.8%, resulting in a loss of 16,294 residents from natural decrease, curtailing Puerto Rico’s growth.
###
Tables
Table 1
| Top 10 Most Populous States: 2023 | ||||
|---|---|---|---|---|
| Rank | Geographic Area | April 1, 2020 (Estimates Base) | July 1, 2022 | July 1, 2023 |
| 1 | California | 39,538,212 | 39,040,616 | 38,965,193 |
| 2 | Texas | 29,145,459 | 30,029,848 | 30,503,301 |
| 3 | Florida | 21,538,216 | 22,245,521 | 22,610,726 |
| 4 | New York | 20,202,320 | 19,673,200 | 19,571,216 |
| 5 | Pennsylvania | 13,002,788 | 12,972,091 | 12,961,683 |
| 6 | Illinois | 12,813,469 | 12,582,515 | 12,549,689 |
| 7 | Ohio | 11,799,331 | 11,759,697 | 11,785,935 |
| 8 | Georgia | 10,713,771 | 10,913,150 | 11,029,227 |
| 9 | North Carolina | 10,439,459 | 10,695,965 | 10,835,491 |
| 10 | Michigan | 10,077,674 | 10,033,281 | 10,037,261 |
Table 2
| Top 10 States by Numeric Growth: 2022 to 2023 | |||||
|---|---|---|---|---|---|
| Rank | Geographic Area | April 1, 2020 (Estimates Base) | July 1, 2022 | July 1, 2023 | Numeric Growth |
| 1 | Texas | 29,145,459 | 30,029,848 | 30,503,301 | 473,453 |
| 2 | Florida | 21,538,216 | 22,245,521 | 22,610,726 | 365,205 |
| 3 | North Carolina | 10,439,459 | 10,695,965 | 10,835,491 | 139,526 |
| 4 | Georgia | 10,713,771 | 10,913,150 | 11,029,227 | 116,077 |
| 5 | South Carolina | 5,118,422 | 5,282,955 | 5,373,555 | 90,600 |
| 6 | Tennessee | 6,910,786 | 7,048,976 | 7,126,489 | 77,513 |
| 7 | Arizona | 7,157,902 | 7,365,684 | 7,431,344 | 65,660 |
| 8 | Virginia | 8,631,373 | 8,679,099 | 8,715,698 | 36,599 |
| 9 | Colorado | 5,773,707 | 5,841,039 | 5,877,610 | 36,571 |
| 10 | Utah | 3,271,614 | 3,381,236 | 3,417,734 | 36,498 |
Table 3
| Top 10 States or State Equivalent by Percent Growth: 2022 to 2023 | |||||
|---|---|---|---|---|---|
| Rank | Geographic Area | April 1, 2020 (Estimates Base) | July 1, 2022 | July 1, 2023 | Percent Growth |
| 1 | South Carolina | 5,118,422 | 5,282,955 | 5,373,555 | 1.7 |
| 2 | Florida | 21,538,216 | 22,245,521 | 22,610,726 | 1.6 |
| 3 | Texas | 29,145,459 | 30,029,848 | 30,503,301 | 1.6 |
| 4 | Idaho | 1,839,117 | 1,938,996 | 1,964,726 | 1.3 |
| 5 | North Carolina | 10,439,459 | 10,695,965 | 10,835,491 | 1.3 |
| 6 | Delaware | 989,946 | 1,019,459 | 1,031,890 | 1.2 |
| 7 | District of Columbia | 689,548 | 670,949 | 678,972 | 1.2 |
| 8 | Tennessee | 6,910,786 | 7,048,976 | 7,126,489 | 1.1 |
| 9 | Utah | 3,271,614 | 3,381,236 | 3,417,734 | 1.1 |
| 10 | Georgia | 10,713,771 | 10,913,150 | 11,029,227 | 1.1 |


