Census Bureau Releases New American Community Survey Selected Population Tables and American Indian and Alaska Native Tables
For Immediate Release: Thursday, June 15, 2023
Census Bureau Releases New American Community Survey Selected Population Tables and American Indian and Alaska Native Tables
JUNE 15, 2023 — The U.S. Census Bureau today released new detailed social, economic, housing and demographic statistics for hundreds of race, tribal, Hispanic origin and ancestry populations based on the 2017-2021 American Community Survey (ACS) 5-year estimates. These data tables are typically released every five years and provide the most detailed information about populations that are not published in the annual ACS, 5-year data products. This is the third time the Census Bureau has released these detailed 5-year estimates. Previous releases are available from the 2011-2015 and 2006-2010 ACS 5-year estimates.
“The Selected Population Tables and the American Indian and Alaska Native Tables provide a unique and vital look at socioeconomic and housing data that are essential to these smaller populations,” said Rachel Marks, chief of the Racial Statistics Branch. “These tables provide communities with specialized statistics to support their needs.”
According to the newly released statistics, 2.7 million U.S. residents identified as American Indian and Alaska Native alone, and 6.3 million as American Indian and Alaska Native alone or in combination with one or more other races from 2017 to 2021.
Among the population age 25 and over, 15.5% of the American Indian and Alaska Native alone, and 21.8% of the American Indian and Alaska Native alone or in combination with one or more other races had a bachelor’s degree or higher; of those, 5.3% of the American Indian and Alaska Native alone, and 7.8% of the American Indian and Alaska Native alone or in combination with one or more other races had a graduate or professional degree.
Other highlights about the American Indian and Alaska Native alone population:
- Among the population enrolled in school (age 3 and over), 43.8% were in grades 1-8.
- Among grandparents living with their own grandchildren under age 18, 45.8% were responsible for their care.
- Among those age 5 and over, 32.1% spoke a language other than English at home.
- Among those age 16 and over, 58.9% were in the labor force.
- Veterans accounted for 6.3% of the civilian population age 18 and over.
- Median household income was $50,183 (in 2021 inflation-adjusted dollars).
- Among occupied housing units, 3.1% had no telephone service available.
Tables on fertility, industry and occupation, and health insurance are also available. Statistics are published for 1,059 population groups provided each group had an estimated population of at least 100 people at the national level. Iterated tables are produced for geographic areas in which a group had a population of at least 50 people in that area who completed the survey. This product includes data for 13 geographic types such as Alaska Native Regional Corporations, American Indian and Alaska Native Areas, and Hawaiian Home Lands.
Selected Population Tables
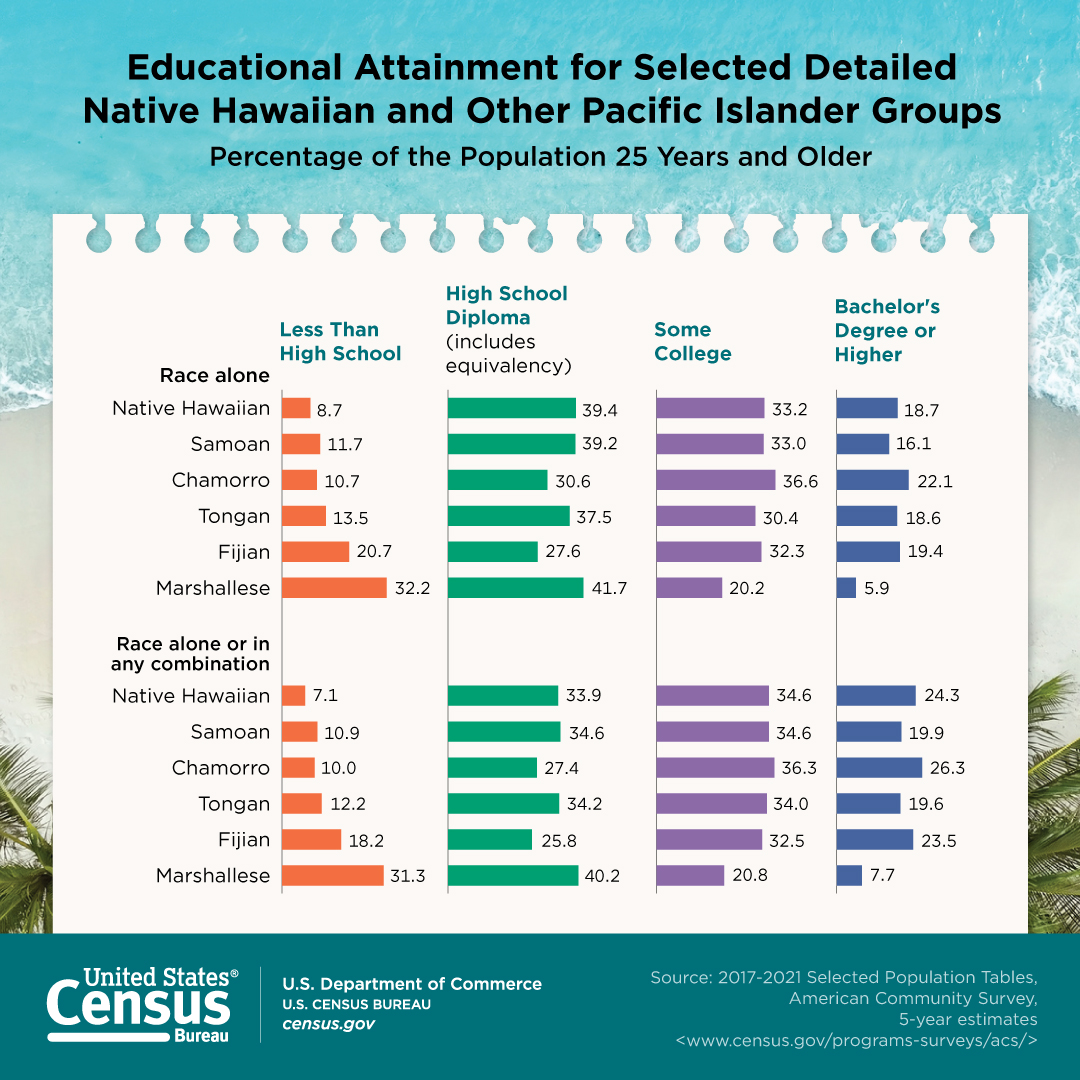
This release includes statistics for 399 race, tribal, Hispanic and ancestry groups with national population estimates of at least 7,000. Statistics are published for individual groups in a particular geographic area if at least 50 people in that group and area completed the survey from 2017 to 2021. These data are available down to the census-tract level for groups that meet both thresholds. Among them: Bhutanese, Fijian, Paraguayan, Algerian, Choctaw tribal grouping, and Tsimshian tribal grouping.
To learn more about the Selected Population Tables and American Indian and Alaska Native Tables, please visit the Race, Ethnicity, Ancestry and American Indian and Alaska Native webpage. Explore the “Documentation” section to find the list of available tables, population groups, geographies and comparison guidance.
Tables are included on topics such as educational attainment, fertility, nativity, income, poverty and homeownership.
About the American Community Survey
The ACS helps local officials, community leaders and businesses understand the changes taking place in their communities. It is the premier source for detailed information about the American people and workforce. The 2017-2021 ACS statistics on race, tribal and Hispanic population group totals are based on a sample of the U.S. population aggregated over a five-year period. These estimates will differ from race, tribal and Hispanic population group totals from the 2020 Census and from the population estimates data products. The 2020 Census reflects a total count of the U.S. population as of April 1, 2020, and provides the official counts (including Hispanic origin and race) of the population and housing units for the nation, states, counties, cities and towns. The population estimates reflect updated estimates of the population for the United States, the 50 states and the District of Columbia, counties, cities and towns. The ACS provides estimates of certain additional characteristics of the population to add rich context for understanding the nation’s population.
###


