An official website of the United States government
Here’s how you know
Official websites use .gov
A .gov website belongs to an official government organization in the United States.
Secure .gov websites use HTTPS
A lock (
) or https:// means you’ve safely connected to the .gov website. Share sensitive information only on official, secure websites.
-
//
- Census.gov /
- Newsroom /
- News Releases /
- Uninsured Health Coverage Rates Decline in Majority of U.S. Counties
Uninsured Health Coverage Rates Decline in Majority of U.S. Counties After ACA
For Immediate Release: Thursday, June 24, 2021
Uninsured Health Coverage Rates Decline in Majority of U.S. Counties After ACA
JUNE 24, 2021 — The rates of Americans under 65 without health insurance decreased significantly between 2013 – the year before many provisions of the Patient Protection and Affordable Care Act (ACA) took effect – and 2019.
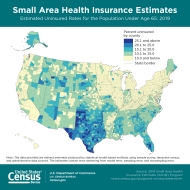
According to the Census Bureau’s 2019 Small Area Health Insurance Estimates (SAHIE) report, uninsured rates dropped in 2,909 U.S. counties and rose in just four counties after implementation of ACA. The lower uninsured numbers held in most of the nation’s roughly 3,141 counties post-ACA, despite inching up in more (237) counties than they decreased in (54) between 2018 and 2019.
SAHIE is the only source of single-year estimates of the number of people with health coverage in each of the nation’s counties. The county statistics are provided by sex and age groups, and at income levels that reflect thresholds for state and federal assistance programs. State estimates include health insurance coverage data by race and Hispanic origin.
In 2019, 33.6% (or 1,054) of U.S. counties had an estimated uninsured rate below 10%, down from 38.6% in 2016, 38.4% in 2017, and 37.7% a year earlier but up from 2013 when only 4.1% or 130 counties had uninsured rates under 10%.
Other SAHIE highlights:
- Estimated county uninsured rates ranged from 2.4% to 35.8%, with a median county uninsured rate of 11.0%.
- The Northeast and Midwest had the nation’s largest share of counties with low (below 10.0%) uninsured rates, and the South had the biggest share with high (above 15.0%) uninsured rates.
- County uninsured rates of working-age adults (ages 18 to 64), living at or below 138% of the poverty level, ranged from 6.1% to 61.9%. The median county uninsured rate among this population was 22.1%.
- In states that expanded Medicaid eligibility, 9.2% of counties (151 of 1,647) had an estimated uninsured rate above 20% among working-age adults living at or below 138% of poverty, compared to 84.8% of counties (1,267 of 1,494) in states that didn’t expand it.
- State uninsured rates varied by race and ethnicity. Non-Hispanic Whites had lower estimated uninsured rates than both Hispanics and non-Hispanic Blacks under age 65 in every state and the District of Columbia. Hispanics had higher estimated uninsured rates than both non-Hispanic Whites and Blacks under age 65 in every state and the District of Columbia.
The 2019 SAHIE report describes demographic and economic differences and trends in health insurance coverage in states and counties. For more information, visit our interactive data and mapping tool on our website at <www.census.gov/data-tools/demo/sahie>. This tool allows users to create and download state and county custom tables, thematic maps, and time-trend charts for all concepts available annually from 2006 to 2019.
No news release associated with this report. Tip sheet only.
###
Share
Contact
Leslie Malone
Public Information Office
301-763-3030
pio@census.gov
 Yes
Yes
 No
NoComments or suggestions?


Top


