For Immediate Release: Thursday, February 18, 2021
Census Bureau Releases 2019 Annual Survey of Manufactures Data
FEB. 18, 2021 — Today the U.S. Census Bureau released data from the 2019 Annual Survey of Manufactures.
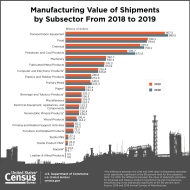
The U.S. manufacturing sector’s value of shipments decreased 2.7%, from $5.9 trillion in 2018 to $5.7 trillion in 2019.
Other highlights include:
- The total value of shipments for the Petroleum Refineries industry (NAICS 324110) was $547.4 billion. This was a 12.4% decrease from 2018.
- The total value of shipments for the Iron and Steel Mills and Ferroalloy Manufacturing industry (NAICS 331110) was $93.7 billion. This was a 8.6% decrease from 2018.
- Among states and equivalents, manufacturing shipments in 2019 ranged from $438.5 million in the District of Columbia to $599.8 billion in Texas.
The 2019 Annual Survey of Manufactures provides manufacturing statistics that are crucial to accurate estimates of domestic production and productivity and to making sound decisions on economic trade policies. Companies, business analysts and trade associations use these data in planning investments, production and marketing. These data are published annually, except in years ending in 2 and 7, at which time they are included in the manufacturing sector of the economic census.
The 2019 General Statistics for Industry Groups and Industries table presents data at the two- through six-digit NAICS levels on statistics such as employment, payroll, cost of materials, operating expenses, value of shipments, value added, and inventories.
The Geographic Area Statistics Summary Statistics for Industry Groups and Industries and Supplemental Statistics tables present manufacturing data for the United States and states at the two- through four-digit NAICS levels and supplemental statistics for the United States and each state at the two-digit NAICS level.
No news release associated with this product. Tip sheet only.
The statistics in this report are estimated from sample surveys and are subject to sampling variability as well as nonsampling error including bias and variance from response, nonreporting and undercoverage. For more information about the Annual Survey of Manufactures methodology, visit www.census.gov/programs-surveys/asm/technical-documentation/methodology.html.
###


