Census Bureau Reports Nationwide Shipment of Goods in 2017 Reached 12.5 Billion Tons and $14.5 Trillion
For Immediate Release: Thursday, July 16, 2020
Census Bureau Reports Nationwide Shipment of Goods in 2017 Reached 12.5 Billion Tons and $14.5 Trillion
Trucks Carried Most of the Load, Hauling 70.9% of 2017 Total Tonnage
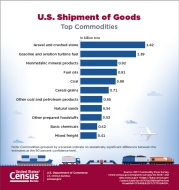
JULY 16, 2020 — The U.S. shipments of goods in 2017 reached 12.5 billion tons, an increase of 1.2 billion tons or 10.4% since the previous Commodity Flow Survey was conducted in 2012, according to the latest estimates released today by the U.S. Census Bureau. The total value of shipments nationwide over the five-year span increased $0.7 trillion or 4.8% to $14.5 trillion (not seasonally adjusted).
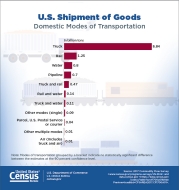
For the first time, the 2017 Commodity Flow Survey included three new tables detailing the breakdown of tonnage by mode of transportation — by truck, by rail and by water. For each of these modes, the majority of the tonnage was shipped using a single mode of transportation. There were 9.4 billion tons of goods shipped using a truck for any part of the distance, with 8.8 billion tons or 93.7% traveling exclusively by truck and not by a combination of truck and other modes. There were 1.9 billion tons shipped by rail, with 1.3 billion tons or 66.8% traveling entirely by rail. Of the 1.1 billion tons shipped by water, 0.8 billion tons or 75.4% traveled solely by water.
Additional highlights:
- The South region shipped 5.2 billion tons, or 41.6%, of U.S. shipments of goods in 2017 valued at $5.4 trillion. The Midwest followed with 3.9 billion tons or 31.0% of goods shipped, valued at $3.9 trillion.
- Manufacturing establishments shipped 4.7 billion tons of commodities worth $5.7 trillion in 2017. Wholesale establishments shipped 4.4 billion tons of commodities worth $6.8 trillion.
- Trucks as a single domestic mode of transportation hauled approximately 70.9%, or 8.8 billion tons of the total tonnage. These shipments accounted for 71.6%, or $10.4 trillion of the total value of commodities shipped in 2017.
- An estimated 57.9% of all tonnage traveled less than 50 miles in 2017.
- Hazardous material shipments weighed 3.0 billion tons and accounted for $1.7 trillion in 2017.
About the Commodity Flow Survey
The Commodity Flow Survey was initiated in 1993. Since 1997, the Commodity Flow Survey has been conducted every five years as part of the Census Bureau’s economic census. The survey, a partnership with the U.S. Department of Transportation, Bureau of Transportation Statistics, is the primary source of national, state and selected metropolitan area statistics on domestic freight shipments. It provides information on the origin and destination, value, weight, mode of transportation, distance, and ton-miles of commodities shipped.
The Commodity Flow Survey provides estimates for the nation, the 50 states and the District of Columbia, and selected metropolitan areas.
Commodity Flow Survey statistics are used by policymakers and transportation planners in various federal, state and local agencies for assessing the demand for transportation facilities and services, energy use and safety risk, and environmental concerns. A sample of approximately 100,000 establishments are selected based on geographic location and industry.
The Commodity Flow Survey does not include establishments classified in forestry, fishing, utilities, construction, transportation, and most retail and services industries. Farms and government-owned entities (except government-owned liquor wholesalers) are also excluded. The survey does not capture information on imports to the United States; however, domestic portions of imported shipments can be included if they pass through a sampled establishment.
Statistics are based on data from the 2017 and 2012 Commodity Flow Surveys and include data only for businesses with paid employees. All dollar values are expressed in current dollars for the period shown, i.e., they are not adjusted for inflation and do not reflect changes in prices. For more information about the survey (including information on comparability, confidentiality protection, sampling error, nonsampling error and definitions), see the Commodity Flow Survey methodology.
All comparisons made in this release have been tested and found to be statistically significant at the 90% confidence level, unless otherwise noted. All estimates include measures of sampling variability. For more information, please visit the Commodity Flow Survey website.
No news release associated with these products. Tip sheet only.
###


