For Immediate Release: Tuesday, December 11, 2018
More Than 76 Million Students Enrolled in U.S. Schools, Census Bureau Reports
Classrooms More Racially and Ethnically Diverse
DEC. 11, 2018 — Today, the U.S. Census Bureau announced the release of new data on the makeup of student bodies from kindergartens to universities across the country. According to the latest data, the number of students nationwide enrolled in school was 76.4 million in 2017, not statistically different from the level in 2016. Those who are enrolled make up 24.7 percent of the population age 3 and older.
Classroom Diversity
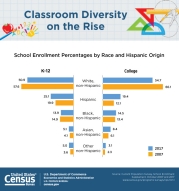
Classrooms are becoming more racially and ethnically diverse. In 2007, 56.7 percent of elementary school students (kindergarten through grade 8) and 66.1 percent of college students (undergraduate and graduate) were non-Hispanic white.
“In 2017, only about half (49.9 percent) of elementary school students and 54.7 percent of college students were non-Hispanic white,” said Kurt Bauman, Chief, Education and Social Stratification Branch. “Non-Hispanic white students now make up 51.9 percent of all people enrolled in school, compared to 59.7 percent in 2007.”
Of just the current undergraduate college student population, 52.9 percent are non-Hispanic white, 20.9 percent are Hispanic, 15.1 percent are black, and 7.6 percent are Asian, while graduate students are 61.2 percent white non-Hispanic, 13.6 percent Hispanic, 12.3 percent black, and 11.2 percent Asian.
High School Enrollment
Since 2007, overall enrollment in high school has not significantly changed; however, more people are graduating from high school. The percentage of 18- to 24-year-olds who graduated from high school increased from 83.9 percent in 2007 to 87.5 percent in 2017. This increase has been particularly pronounced among the Hispanic population, which saw an increase in graduation from 67.4 percent in 2007 to 82 percent in 2017.
College Enrollment
While the number enrolled in college was unchanged from 10 years ago, there was substantive change over the past decade — the overall number climbed by around 2 million from 2007 to 2011 before receding to 18.4 million in 2017. Today, women continue to be a majority on college campuses at 54.9 percent of undergraduate students and 59.8 percent of graduate students. Only 29.3 percent of undergraduate college students are attending two-year institutions.
Attending school part time:
- 37.1 percent of two-year college students.
- 16.2 percent of undergraduate four-year college students.
- 40.4 percent of graduate school students.
School Enrollment Tables
The updated tables provide information by age, sex, race, Hispanic origin, family income, type of college, employment status, nativity, foreign-born parents, attendance status (full or part time), type of school (public or private), and vocational course enrollment. They also delve into topics such as nursery school and kindergarten enrollment, the likelihood of enrollment in a grade appropriate for their age, and the percentage of young adults enrolled in college. Historical time series tables and visualizations are also provided.
School enrollment data are obtained from the Current Population Survey (CPS). The CPS is the primary source of labor force statistics for the population of the United States and is used to collect data for a variety of other studies that keep the nation informed of the economic and social well-being of its people.
###


