For Immediate Release: Thursday, June 21, 2018
Nonemployer Establishments in Taxi and Limousine Service Grew by 45.9 Percent
JUNE 21, 2018 — Nonemployer establishments, which are establishments without paid employees, in the Transportation and Warehousing sector (North American Industry Classification System (NAICS 48-49 ) increased by 22.0 percent from 1,528,264 in 2015 to 1,864,990 in 2016, according to U.S. Census Bureau statistics released today. This sector also had the largest percentage increase in receipts, 3.7 percent, from $83.9 billion in 2015 to $87.0 billion in 2016.
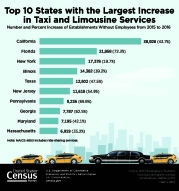
The Transit and Ground Passenger Transportation subsector (NAICS 485) led the growth with an increase of 291,243 establishments, an increase of 50.4 percent. This subsector also grew by the most nonemployer establishments among all three-digit NAICS across all sectors. Examples of the Transit and Ground Passenger Transportation subsector include taxi and limousine services, chartered bus, school bus and special needs transportation. Specifically, the industry Taxi and Limousine Service (NAICS 4853), which includes ridesharing services, grew by 45.9 percent, an increase of 220,261 establishments. The top three states with the highest growth in nonemployer establishments in this industry are California (adding 38,928 or 43.7 percent), Florida (adding 21,858 or 72.3 percent), and New York (adding 17,378 19.7 percent).
Nationally, nonemployer establishments increased 2.0 percent from 24,331,403 in 2015 to 24,813,048 in 2016. Receipts increased 1.5 percent from $1.15 trillion in 2015 to $1.17 trillion in 2016.
Other highlights include:
- Nevada, the District of Columbia and Utah led all states in the rate of increase in the number of nonemployer establishments between 2015 and 2016. Nevada rose 7.2 percent (adding 14,806), the District of Columbia increased 5.4 percent (adding 3,039), and Utah saw a 4.2 percent increase (adding 9,103). Receipts increased the most in Delaware up 6.9 percent or $254 million in 2016.
- Among the 50 counties with the most nonemployer establishments, Clark County, Nevada, led the Transit and Ground Passenger Transportation industry (NAICS 485) in annual growth in the number of nonemployer establishments increasing 187.7 percent in 2016.
- Among the top 50 U.S. Counties with the most nonemployers, four of the top ten for nonemployer establishment growth were in Texas:
- Collin County, Texas (whose largest city is Plano), with a growth of 5.1 percent and an increase of 4,373 nonemployer establishments.
- Tarrant County, Texas (whose largest city is Fort Worth), with a growth of 4.4 percent and an increase of 7,224 nonemployer establishments.
- Bexar County, Texas (whose largest city is San Antonio), with a growth of 4.2 percent and an increase of 5,524 nonemployer establishments.
- Dallas County, Texas (whose largest city is Dallas), with a growth of 3.9 percent and an increase of 8,866 nonemployer establishments.
- In these four Texas counties, the Transit and Ground Passenger Transportation sector (NAICS 485) drove the increase between 2015 and 2016.
- The number of nonemployer establishments with receipts $5 million or more decreased from 355 in 2015 to 316 in 2016. Over 70 percent of those earning $5 million or more were in the Finance and Insurance sector (NAICS 52) in 2016.
These data are all part of Nonemployer Statistics: 2016, which publishes statistics on nonemployer businesses in over 450 industries at varying levels of geography, including national, state, county, metropolitan statistical area and combined statistical area. The data are also presented by Legal Form of Organization, and by Receipt Size Class.
A nonemployer business is defined as one that has no paid employees, has annual business receipts of $1,000 or more ($1 or more in the construction industries), and is subject to federal income taxes. Most nonemployers are self-employed individuals operating very small unincorporated businesses, which may or may not be the owner’s principal source of income. Nonemployer statistics originate from Internal Revenue Service tax return information. The data are subject to nonsampling error, such as errors of self-classification by industry on tax forms, as well as errors of response, nonreporting and coverage. Receipts totals are slightly modified to protect confidentiality. All dollar values are expressed in current dollars, i.e., they are not adjusted for price changes. Further information about methodology and data limitations is available at <www.census.gov/econ/nonemployer/methodology.htm>.
# # #


