For Immediate Release: Wednesday, December 19, 2018
Nevada and Idaho Are the Nation’s Fastest-Growing States
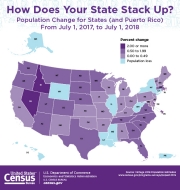
DEC. 19, 2018 — The U.S. population grew by 0.6 percent and Nevada and Idaho were the nation’s fastest-growing states between July 1, 2017, and July 1, 2018. Both states’ populations increased by about 2.1 percent in the last year alone. Following Nevada and Idaho for the largest percentage increases in population were Utah (1.9 percent), Arizona (1.7 percent), and Florida and Washington (1.5 percent each).
Washington, D.C., reached a population of 702,455 in July 2018, surpassing 700,000 for the first time since 1975, according to the U.S. Census Bureau’s national and state population estimates released today. The change is due primarily to an influx of people from other parts of the country that began early in the decade. While the increase has begun to slow, the District of Columbia still grew by almost 1 percent last year.
Population declines were also common, with losses occurring in nine states and Puerto Rico. The nine states that lost population last year were New York (down 48,510), Illinois (45,116), West Virginia (11,216), Louisiana (10,840), Hawaii (3,712), Mississippi (3,133), Alaska (2,348), Connecticut (1,215) and Wyoming (1,197).
“Many states have seen fewer births and more deaths in recent years,” said Sandra Johnson, a demographer/statistician in the Population Division of the Census Bureau. “If those states are not gaining from either domestic or international migration they will experience either low population growth or outright decline.”
Nationally, natural increase (the excess of births over deaths) was 1.04 million last year, reflecting 3,855,500 births and 2,814,013 deaths. With fewer births in recent years and the number of deaths increasing, natural increase has declined steadily over the past decade. In 2008, natural increase was nearly 1.8 million (based on National Center for Health Statistics data).
Also released today were national- and state-level estimates of the components of population change, which include tables on births, deaths and migration.
Puerto Rico Population Estimates
The new estimates show that Puerto Rico’s population has continued to decline, with an estimated loss of 129,848 people (3.9 percent) between July 1, 2017, and July 1, 2018.
“Puerto Rico has seen a steady decline in population over the last decade,” said Sandra Johnson. “Hurricane Maria in September of 2017 further impacted that loss, both before and during the recovery period.”
Puerto Rico had a total population of 3,195,153 in 2018, a decrease from 3,726,157 in 2010. The decrease in Puerto Rico’s population is primarily due to higher rates of out-migration over in-migration and natural increase.
Highlights (July 1, 2017, to July 1, 2018):
- As a whole, the U.S. population continues to grow due to both natural increase and international migration. Though international migration was slightly higher last year (978,826 compared to 953,233 the year before), natural increase was slightly lower last year (1,041,487 compared to 1,122,546 the year before).
- Texas had the largest numeric growth over the last year, with an increase of 379,128 people. Texas grew both from having more births than deaths and from net gains in movers from within and outside the United States.
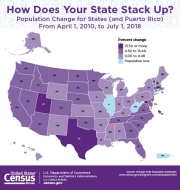
- Florida had the highest level of net domestic migration in the last year, at 132,602. Since 2010, Florida has gained a total of 1,160,387 people from net domestic migration.
- The voting age population, those 18 years and over, increased by 0.9 percent to 253,768,092 people in 2018.
The estimates are as of July 1, 2018, and therefore do not reflect the effects of Hurricane Florence in September 2018, Hurricane Michael in October 2018, and the California Wildfires.
During 2019, the Census Bureau will release estimates of the 2018 population for counties, cities and towns, and metropolitan and micropolitan statistical areas, as well as national, state and county population estimates by age, sex, race and Hispanic origin. Population estimates for Puerto Rico and its municipios by age and sex will be released as well. These estimates include counties and cities affected by the 2017 hurricane season.
###
Top 10 Most Populous States: 2018
| Rank | Name | 2010 | 2017 | 2018 |
|---|---|---|---|---|
| 1 | California | 37,254,523 | 39,399,349 | 39,557,045 |
| 2 | Texas | 25,146,114 | 28,322,717 | 28,701,845 |
| 3 | Florida | 18,804,580 | 20,976,812 | 21,299,325 |
| 4 | New York | 19,378,124 | 19,590,719 | 19,542,209 |
| 5 | Pennsylvania | 12,702,873 | 12,790,447 | 12,807,060 |
| 6 | Illinois | 12,831,572 | 12,786,196 | 12,741,080 |
| 7 | Ohio | 11,536,757 | 11,664,129 | 11,689,442 |
| 8 | Georgia | 9,688,709 | 10,413,055 | 10,519,475 |
| 9 | North Carolina | 9,535,736 | 10,270,800 | 10,383,620 |
| 10 | Michigan | 9,884,117 | 9,976,447 | 9,995,915 |
Top 10 States in Numeric Growth: 2017 to 2018
| Rank | Name | 2010 | 2017 | 2018 | Numeric growth |
|---|---|---|---|---|---|
| 1 | Texas | 25,146,114 | 28,322,717 | 28,701,845 | 379,128 |
| 2 | Florida | 18,804,580 | 20,976,812 | 21,299,325 | 322,513 |
| 3 | California | 37,254,523 | 39,399,349 | 39,557,045 | 157,696 |
| 4 | Arizona | 6,392,288 | 7,048,876 | 7,171,646 | 122,770 |
| 5 | North Carolina |
9,535,736 | 10,270,800 | 10,383,620 | 112,820 |
| 6 | Washington |
6,724,540 | 7,425,432 | 7,535,591 | 110,159 |
| 7 | Georgia |
9,688,709 | 10,413,055 | 10,519,475 | 106,420 |
| 8 | Colorado | 5,029,316 | 5,615,902 | 5,695,564 | 79,662 |
| 9 | South Carolina |
4,625,381 | 5,021,219 | 5,084,127 | 62,908 |
| 10 | Nevada |
2,700,679 | 2,972,405 | 3,034,392 | 61,987 |
Top 10 States in Percentage Growth: 2017 to 2018
| Rank | Name | 2010 | 2017 | 2018 | Percent growth |
|---|---|---|---|---|---|
| 1 | Nevada |
2,700,679 | 2,972,405 | 3,034,392 | 2.1 |
| 2 | Idaho |
1,567,657 | 1,718,904 | 1,754,208 | 2.1 |
| 3 | Utah | 2,763,891 | 3,103,118 | 3,161,105 | 1.9 |
| 4 | Arizona |
6,392,288 | 7,048,876 | 7,171,646 | 1.7 |
| 5 | Florida | 18,804,580 | 20,976,812 | 21,299,325 | 1.5 |
| 6 | Washington |
6,724,540 | 7,425,432 | 7,535,591 | 1.5 |
| 7 | Colorado |
5,029,316 | 5,615,902 | 5,695,564 | 1.4 |
| 8 | Texas |
25,146,114 | 28,322,717 | 28,701,845 | 1.3 |
| 9 | South Carolina |
4,625,381 | 5,021,219 | 5,084,127 | 1.3 |
| 10 | North Carolina |
9,535,736 | 10,270,800 | 10,383,620 | 1.1 |


