"Halloween: Oct. 31, 2018"
Dating back 2,000 years to the Celtic festival of Samhain, Halloween is an ancient tradition associated with images of witches, ghosts and vampires. Today, Halloween has evolved into a celebration characterized by child-friendly activities like trick-or-treating, carving pumpkins into jack-o’-lanterns, and dressing in costumes.
The following facts are made possible by the invaluable responses to the U.S. Census Bureau’s surveys. We appreciate the public’s cooperation as we continuously measure America’s people, places and economy.
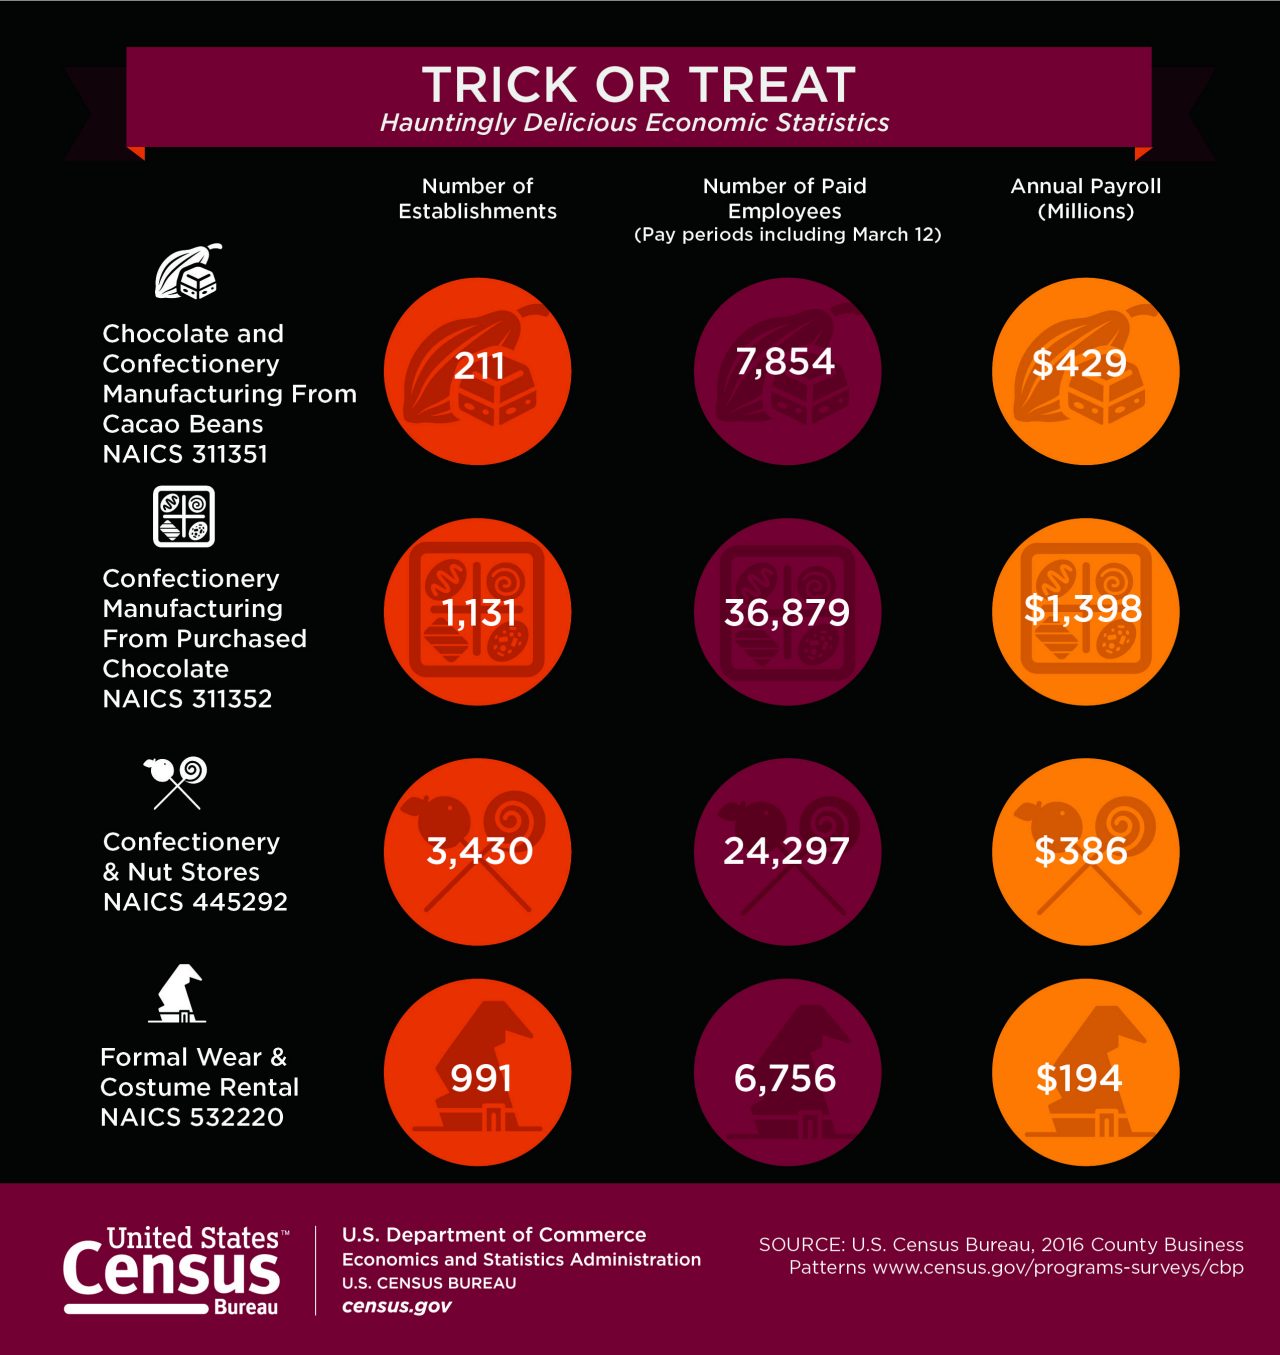
Trick or Treat!
Source:
Source:
Hauntingly Delicious Economic Statistics
40,411
The number of people employed by U.S. manufacturing establishments that produced chocolate and cocoa products in 2016.
Source:
3,430
The number of U.S. confectionary and nut stores that sold candy and other confectionary products in 2016.
Source:
Source:
Scary Places
Tombstone, Ariz. (estimated population 1,296)
Source: 2017 Population Estimates
Sleepy Hollow, N.Y. (estimated population 10,218)
Source: 2017 Population Estimates
Kill Devil Hills, N.C. (estimated population 7,117)
Source: 2017 Population Estimates
Yellville, Ark. (estimated population 1,159)
Source: 2017 Population Estimates
Transylvania County, N.C. (estimated population 33,956)
Source: 2017 Population Estimates
Slaughter Beach, Del. (estimated population 234)
Source: 2017 Population Estimates
Casper, Wyo. (estimated population 57,814)
Source: 2017 Population Estimates
Scarville, Iowa (estimated population 70)
Source: 2017 Population Estimates
Related News Products
Previous Facts for Features
Previous Graphics
Editor’s note: The preceding data were collected from a variety of sources and may be subject to sampling variability and other sources of error.
###
The following is a list of observances typically covered by the Census Bureau’s Facts for Features series:
| Black (African American) History Month (February) Women's History Month (March) Irish-American Heritage Month (March) Asian/Pacific American Heritage Month (May) The Fourth of July (July 4) Anniversary of Americans With Disabilities Act (July 26) Hispanic Heritage Month (Sept. 15-Oct. 15) Halloween (Oct. 31) American Indian/Alaska Native Heritage Month (November) Veterans Day (Nov. 11) Thanksgiving Day/Holiday Season (November-December) |
Editor’s note: The preceding data were collected from a variety of sources and may be subject to sampling variability and other sources of error. Facts for Features are customarily released about two months before an observance in order to accommodate magazine production timelines. Questions or comments should be directed to the Census Bureau’s Public Information Office: telephone: 301-763-3030; or e-mail: pio@census.gov.
Profile America's Facts for Features provides statistics related to observances and holidays not covered by Stats for Stories. For observances not listed below, visit our Stats for Stories web page.
Profile America's Stats for Stories provides links to timely story ideas highlighting the Census Bureau's newsworthy statistics that relate to current events, observances, holidays, and anniversaries. The story ideas are intended to assist the media in story mining and producing content for their respective audiences.


