Facts for Features: *Special Edition* The 50th Anniversary of the I Have a Dream Speech and the March on Washington for Jobs and Freedom
Facts for Features: *Special Edition* The 50th Anniversary of the I Have a Dream Speech and the March on Washington for Jobs and Freedom
On Aug. 28, 1963, Martin Luther King Jr. spoke to more than 200,000 people from the steps of the Lincoln Memorial during the March on Washington for Jobs and Freedom. His famous "I Have a Dream" speech and the march were key moments in the American Civil Rights Movement, before the landmark legislation securing voting, housing and employment rights for all Americans regardless of race. To mark the anniversary, the U.S. Census Bureau has gathered key statistics that measure changes in some characteristics of the black population to date.
Note: The analysis is limited to the black population because of limited historical data for all racial and ethnic groups. Unless otherwise noted, the reference to the 2012 black population in this publication is to respondents who said they were one race (black) or more than one race (black plus other races).
Population
| 1963 | 2012 |
|---|---|
| 20,255,067 The total estimated black population in the United States. |
44,456,009 The total estimated black population in the United States. |
| 10.7% The estimated percentage of the U.S. population that was black. |
14.2% The estimated percentage of the U.S. population that was black. |
Sources: //www.census.gov/popest/data/national/asrh/pre-1980/tables/PE-11-1963.xls
(1963)
//factfinder2.census.gov/bkmk/table/1.0/en/PEP/2012/PEPALL5N?slice=year~est72012
Voting
| 1964 | 2012 |
|---|---|
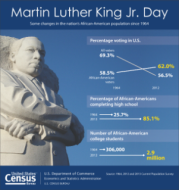
| 58.5% The percent of the total black population 18 years and older who voted in the presidential election. |
62% The percent of the total black population 18 years and older who voted in the presidential election. |
| 69.3% The percent of the total U.S. population 18 and older that voted in the presidential election. |
56.5% The percent of the total U.S. population 18 and older that voted in the presidential election. |
Sources: //www.census.gov/hhes/www/socdemo/voting/publications/historical/A1.xls
//www.census.gov/newsroom/releases/archives/voting/cb13-84.html
Elected Officials
| 1970 | 2011 |
|---|---|
| 1,469 The number of black elected officials, the first year this kind of information was collected. |
10,500 The estimated number of black elected officials. |
(Data courtesy of the Joint Center for Political and Economic Studies.)
Source: //www.jointcenter.org/sites/default/files/upload/research/files/National Roster of Black Elected Officials Fact Sheet.pdf [PDF - <1.0 MB]
Income
| 1963 | 2011 |
|---|---|
| $22,266 (in 2011 dollars) The median family income for blacks was 55 percent of the median income for all American families. |
$40,495 The median family income for the black-alone population was 66 percent of the median income for all American families. |
| $25,826 and $14,651 (in 2011 dollars) Median income of black men and black women who worked full time, year-round. |
$40,273 and $35,146 Median income of single-race black men and black women who worked full time, year-round. |
Sources: //www.census.gov/hhes/www/income/data/historical/families/2011/F05_2011.xls
//www.census.gov/hhes/www/income/data/historical/people/2011/P36B_2011.xls
Poverty
| 1966 | 2011 |
|---|---|
| 41.8% Poverty rate for blacks — 1966 is the closest year these statistics are available to the historic speech. Nationally, the poverty rate for all races was 14.7 percent. |
27.6% Poverty rate for single-race blacks. Nationally, the poverty rate for all races was 15 percent. |
Source: //www.census.gov/hhes/www/poverty/data/historical/hstpov2.xls
Housing
| 1970 | 2011 |
|---|---|
| 41.6% Homeownership rate for blacks — 1970 is the earliest this information is available for race. |
43.4% Homeownership rate for blacks. |
| 15.3% Percentage of U.S. renter occupied housing units that were black households. |
19.3% Percentage of U.S. renter occupied housing units that were black households. |
Note: The estimates in this section for 2011 pertain to the single-race black population.
Sources: //www2.census.gov/prod2/decennial/documents/13276827v1p1.zip (1970: Ch. 1, table 3)
//factfinder2.census.gov/bkmk/table/1.0/en/ACS/11_1YR/B25003B (2011, single-race black)
//factfinder2.census.gov/bkmk/table/1.0/en/ACS/11_1YR/B25003 (2011, total U.S. population)
High School Graduates
| 1964 | 2012 |
|---|---|
| 25.7% Percentage of blacks age 25 and over who completed at least four years of high school. |
85.0% Percentage of blacks age 25 and over who completed at least four years of high school. |
| 2.4 million Number of blacks 25 and over with at least four years of high school. |
20.3 million Number of blacks 25 and over with at least a high school diploma. |
Note: The 2011 information in this section refers to the single-race black population.
Source: //www.census.gov/hhes/socdemo/education/data/cps/1964/tab-01.pdf [PDF - 1.3 MB]
//www.census.gov/hhes/socdemo/education/data/cps/historical/tabA-2.xls
//www.census.gov/hhes/socdemo/education/data/cps/2012/tables.html, Table 1
College Students and Graduates
| 1964 | 2012 |
|---|---|
| 234,000 Number of black undergraduate college students. |
2.6 million Number of black undergraduate college students in 2011 — this is more than 10 times as many as 1964. |
| 3.9% Percent of blacks age 25 and over who completed at least four years of college. |
21.2% Percent of blacks age 25 and over who completed at least four years of college. |
| 365,000 Number of blacks who had at least a bachelor's degree. |
5.1 million Number of blacks who had at least a bachelor's degree. |
All the 2011/2012 information in this section pertains to the black alone population.
Sources: //www.census.gov/hhes/school/data/cps/1964/tab03-05.pdf [PDF - <1.0 MB] (1964) Table 5
//www.census.gov/hhes/school/data/cps/2011/tables.html, Table 5
//www.census.gov/hhes/socdemo/education/data/cps/historical/tabA-2.xls
//www.census.gov/hhes/socdemo/education/data/cps/1964/tab-01.pdf [PDF - 1.3 MB], page 12.
//www.census.gov/hhes/socdemo/education/data/cps/2012/Table1-04.xls
//www.census.gov/hhes/socdemo/education/data/cps/2012/tables.html, Table 1.
Other Resources:
The following is a list of observances typically covered by the Census Bureau’s Facts for Features series:
| Black (African American) History Month (February) Super Bowl Valentine's Day (Feb. 14) Women's History Month (March) Irish-American Heritage Month (March)/ St. Patrick's Day (March 17) Earth Day (April 22) Asian/Pacific American Heritage Month (May) Older Americans Month (May) Mother's Day Hurricane Season Begins (June 1) Father's Day |
The Fourth of July (July 4) Anniversary of Americans With Disabilities Act (July 26) Back to School (August) Labor Day Grandparents Day Hispanic Heritage Month (Sept. 15-Oct. 15) Unmarried and Single Americans Week Halloween (Oct. 31) American Indian/Alaska Native Heritage Month (November) Veterans Day (Nov. 11) Thanksgiving Day The Holiday Season (December) |
Editor’s note: The preceding data were collected from a variety of sources and may be subject to sampling variability and other sources of error. Facts for Features are customarily released about two months before an observance in order to accommodate magazine production timelines. Questions or comments should be directed to the Census Bureau’s Public Information Office: telephone: 301-763-3030; or e-mail: pio@census.gov.


