How Updating Annual Poverty Thresholds Impacts Poverty Rates
In Poverty in the United States: 2023, the U.S. Census Bureau released updated estimates of the official poverty measure and the Supplemental Poverty Measure (SPM). Notably, the official poverty rate fell in 2023 by 0.4 percentage points to 11.1%, while the SPM rate increased by 0.5 percentage points to 12.9%. A primary reason for these results is the differences in the way poverty thresholds, or the definition of basic needs, are updated each year. To learn why the Census Bureau produces two different rates on poverty (the official poverty measure and the SPM), check out our recently released blog on the topic.
How Official Poverty Measure Thresholds Are Adjusted
The official poverty measure has been produced since the 1960s and defines poverty by comparing pretax money income to a national poverty threshold that varies by family size and age of the householder. The poverty threshold was originally defined as three times the cost of a minimum food diet in 1963 and is annually adjusted for inflation using the Consumer Price Index for All Urban Consumers (CPI-U). The CPI-U is the headline inflation statistic produced monthly by the Bureau of Labor Statistics (BLS) and considers consumer spending across a number of different goods and services. Conceptually, the CPI-U is capturing a general sense of changes in cost of living over time.1
How Supplemental Poverty Measure Thresholds Are Adjusted
First released in 2011, the SPM was developed after significant research and consideration following the 1995 National Academies of the Sciences panel on measuring poverty. The measure is produced in collaboration with BLS. The SPM defines poverty by comparing a wider definition of resources (including noncash government benefits, taxes and credits, and necessary expenses) to a threshold that is defined as 83% of the total spending of a median consumer unit on food, clothing, shelter, utilities, telephone, and internet (FCSUti). The thresholds are constructed for three housing tenure groups (owners with a mortgage, owners without a mortgage, and renters) and are adjusted for geographic variation in housing costs across the country. BLS produces SPM thresholds each year using information on FCSUti expenditures from five years of Consumer Expenditure Survey data, lagged by one year. To equalize the data across the five-year period, prior year expenditures are adjusted for inflation using a limited price index that includes only the FCSUti items.2 As a result, year-to-year changes in the SPM thresholds reflect changes in a narrower definition of cost of living (through FCSUti inflation) and updated spending patterns on those items (through new data).
Impact of Updating Poverty Thresholds
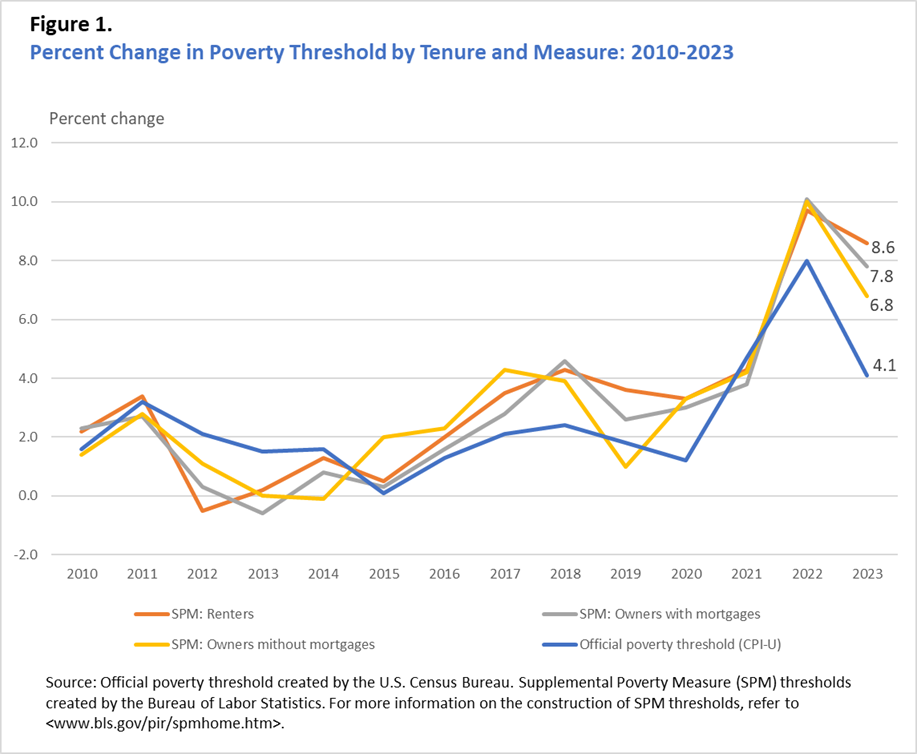
The year-to-year rates of change for the poverty thresholds are shown in Figure 1. The year-to-year increase in the SPM thresholds for owners with a mortgage (7.8%) and renters (8.6%) were both larger in 2023 than the increase in the official poverty thresholds (4.1%).3 Although this is uncommon in the series, it reflects the fact that shelter inflation remained high in 2023 according to BLS.4 The only other time there was a statistical difference between the SPM threshold adjustments and the official poverty threshold adjustments was 2020, when the renter’s SPM threshold adjustment (3.3%) was larger than the CPI-U (1.2%).5
It is possible to evaluate the impact of how the poverty thresholds are updated by taking the 2022 SPM poverty thresholds and adjusting them using the CPI-U inflation rate used for the official measure. This, effectively “anchors” the SPM in the living standards of 2022 while updating thresholds for price increases between 2022 and 2023 (hereafter referred to as anchored SPM). Figure 2 plots these estimates alongside the 2023 SPM rates as published in Poverty in the United States: 2023. The anchored SPM in 2023 would have been 12.0%, 0.9 percentage points lower than the published SPM estimate in 2023. The differences between the published and anchored SPM are statistically significant for all the presented demographic and housing tenure groups. The impact of the threshold adjustments is especially apparent when examining housing tenures, as the anchored SPM for renters is about 2 percentage points lower than the published SPM. This is about four times larger than the difference for owners with a mortgage (0.4 percentage points lower) and those who own their home without a mortgage (0.5 percentage points lower).6
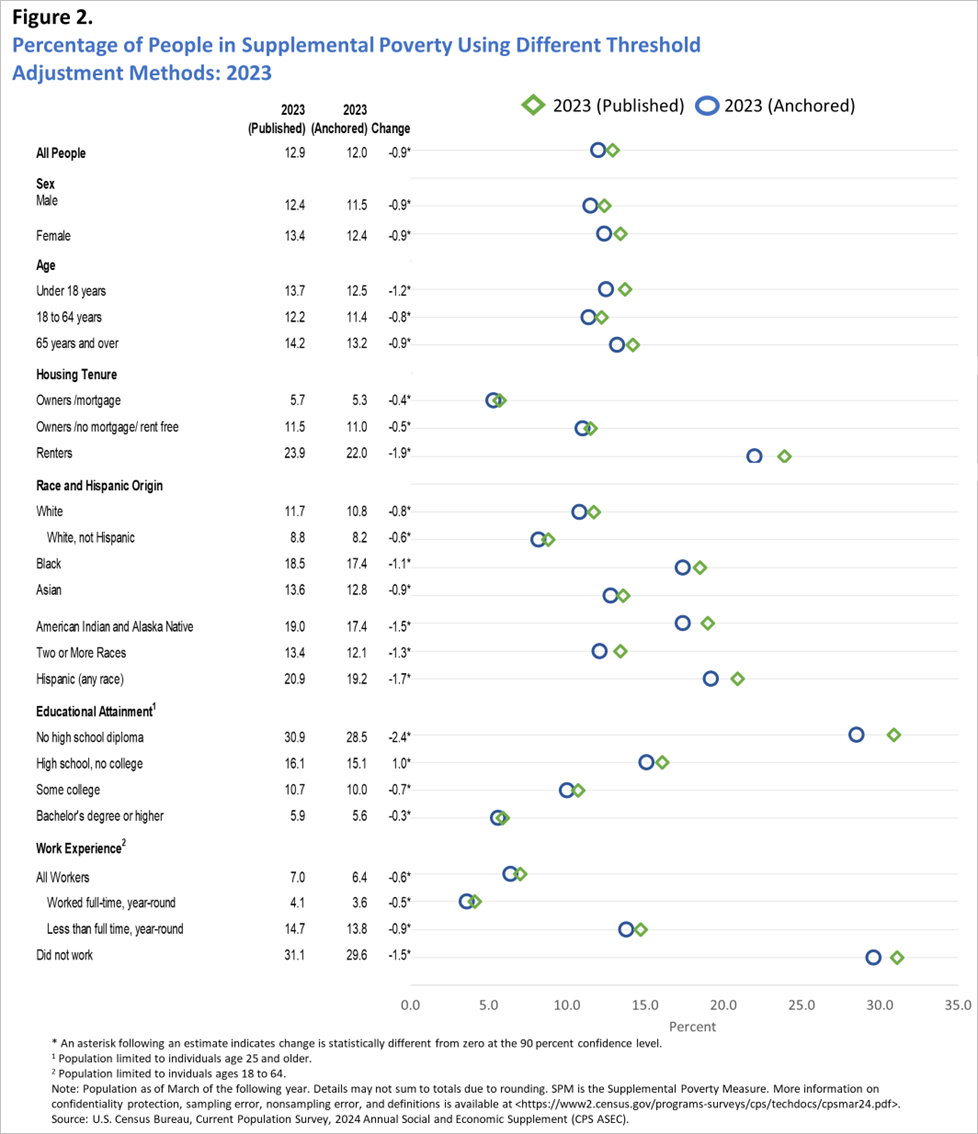
Figure 3 plots the year-to-year differences in poverty rates using the 2022 published SPM and the 2023 anchored SPM. This comparison results in a different interpretation of the changes in poverty rates between the two years, as the 2023 anchored SPM would not have been statistically different from the published 2022 SPM rate which was 12.4%. Some groups in the figure, such as those who own their home without a mortgage, demonstrated significant declines in the poverty rate. There would have been no significant increases in the poverty rate using this methodology for the other groups shown.
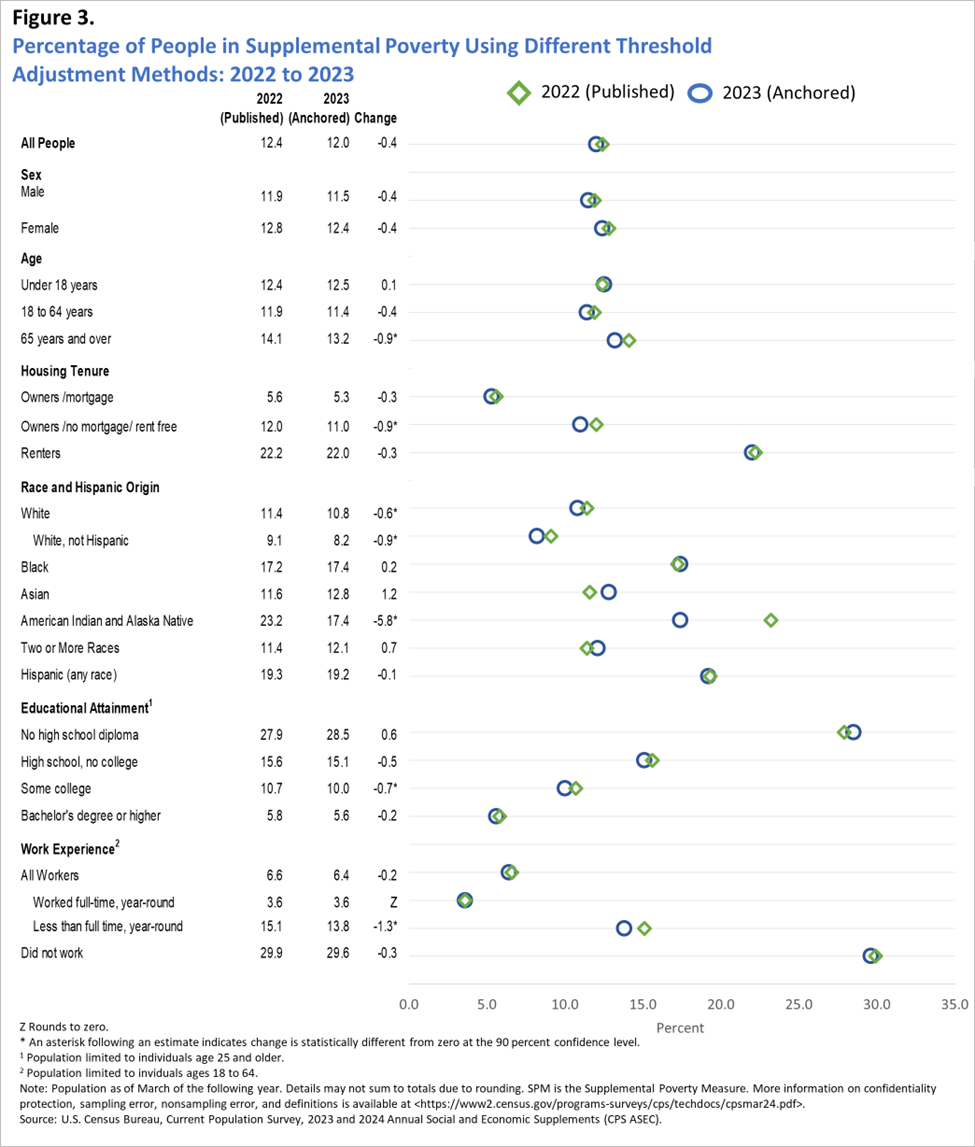
Notably, the difference between the 2022 SPM and 2023 anchored SPM was not statistically different from the year-to-year difference in the official poverty measure which declined 0.4 percentage points to 11.1%. In other words, year-to-year changes across both measures are not significantly different when using the same methodology to adjust both sets of 2022 thresholds to 2023.
After many years of research and consideration, the SPM was designed to capture both changes in standards of living and prices over time, rather than just changes in price levels like the official poverty measure. In most years this conceptual difference is not consequential, as the annual adjustments to the SPM thresholds and the official poverty thresholds have typically not been statistically different. However, in 2023, these differences were statistically different. This indicates that the divergence between published 2022-2023 SPM and official poverty rates is largely due to differences in how poverty thresholds are updated annually rather than differences in resources.
More information on poverty estimates can be found in Poverty in the United States: 2023.
Definitions and information on confidentiality protection, sampling error, and nonsampling error are available at https://www2.census.gov/programs-surveys/cps/techdocs/cpsmar24.pdf. All comparative statements have undergone statistical testing and are statistically significant at the 90 percent confidence level unless otherwise noted.
####
1 For more information on the CPI-U, refer to https://www.bls.gov/cpi/.
2 For more information on BLS’ contributions to the SPM, refer to https://www.bls.gov/pir/spmhome.html.
3 The rates of change in the SPM thresholds for renters and owners with a mortgage were not statistically different. The rate of change in the SPM thresholds for owners without a mortgage and the official poverty threshold adjustment (CPI-U) was not statistically different.
4 For more information on the year-to-year changes in thresholds refer to https://www.bls.gov/pir/spm/spm_thresholds_2023.htm.
5 The year-to-year percent change in the SPM thresholds were not statistically different across the three tenure groups for any year in the SPM series.
6 The percentage point differences between the published SPM and the anchored SPM for owners with a mortgage and owners without a mortgage were not statistically different.