Fourth Wave of 2014 Survey of Income and Program Participation (SIPP)
Fourth Wave of 2014 Survey of Income and Program Participation (SIPP)
In March 2017, we released the first version of the 2014 Survey of Income and Program Participation (SIPP) Wave 1 data. This marked the initial data product from a new data collection instrument and new data processing system. It also represents the continuation of a near 40-year history (beginning with the Income Survey Development Project in 1978) of SIPP collecting data to help improve the nation’s understanding of household income dynamics, program use, health insurance coverage, family structure and change, and the interrelationships of these topics. We are now pleased to release the fourth wave of the 2014 SIPP panel with data covering calendar year 2016.
The SIPP content is built around primary topic areas, including labor force, program participation, income, and health insurance. Questions in these areas are designed to measure the economic situation of people in the United States. These questions expand the data currently available on the distribution of cash and non-cash income. The survey also includes questions on a variety of topics such as residences, school enrollment, marital history, child care, assets and wealth, program eligibility, child support, utilization and cost of health care, disability, school enrollment, taxes, adult and child well-being, and annual income.
Completing the four-year 2014 SIPP panel with data from 2013 through 2016, data from the SIPP provide a truly unique perspective on economic behavior. Its design enables us to examine key dynamic events—SIPP is the only survey that allows us to understand the monthly and yearly longitudinal relationship between demographic change (e.g., marriage, childbirth, divorce, widowhood, and other life-course events) and economic change. Besides its strengths as a longitudinal survey, SIPP is the only regular source for valuable cross-sectional data. Such data include the cost of child care, non-income measures of economic hardship, child disability, the relationship between adult disability and economic well-being, pension coverage, housing affordability, and financial assistance for education. In addition, it is one of the few sources of data on household wealth.
Because of this capability, policy analysts have used the data to examine topics such as:
- Program eligibility and participation rates in the Supplemental Nutrition Assistance Program (SNAP), including analysis of dynamics.
- The gain or loss of health insurance that is useful in the development and evaluation of current and prospective health insurance programs, and the dynamics of health insurance coverage of children.
- Income and poverty changes over both short (month-to-month) and multiyear periods.
- Welfare program participation.
- The income replacement role of unemployment compensation and its effects on reemployment.
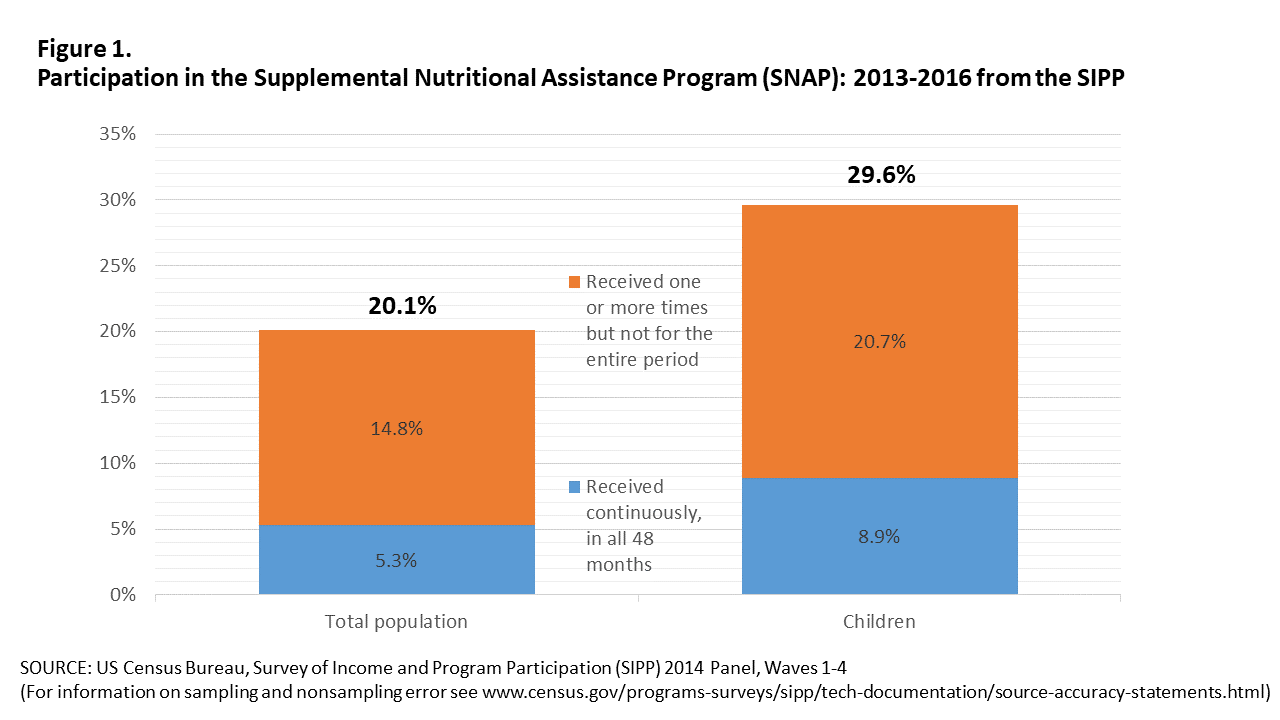
Using SIPP Wave 4 data, we can examine participation in the Supplemental Nutrition Assistance Program.
Figure 1–SNAP Dynamics 2013-2016.
- One out of five people received SNAP benefits at some time between January 2013 and December 2016 (20.1%). For children under the age of 18, 29.6% received benefits.
- 5.3% of the population (8.9% of children) received SNAP benefits for the entire 48 months.
- In addition to processing and reviewing data, our subject matter staff in the Social, Economic, and Housing Statistics Division have been working on SIPP briefs, reports, and conference presentations. Briefs have been released on topics including demographics and living arrangements, fertility, poverty, program participation, wealth, disability, well-being, health status and utilization, with more forthcoming.
- The SIPP program has also been pushing boundaries in the way we design, conduct, and evaluate the SIPP. To support data users in working with the new SIPP data, we accompany the data release with new metadata and tools like the eCodebook. In addition, workshops and webinars sharing information to help users work with SIPP data have been released and presented in many venues.


