Calculating Poverty Rates for Same-Sex Married Couples in 2017
Calculating Poverty Rates for Same-Sex Married Couples in 2017
Analysts at the U.S. Census Bureau will present research to the Population Association of America on how poverty rates could be calculated for same-sex married couples in the 2018 Current Population Survey Annual Social and Economic Supplement.
The Current Population Survey Annual Social and Economic Supplement currently codes survey respondents who report being in a same-sex marriage as same-sex unmarried partners. Other household surveys, such as the American Community Survey and Survey of Income and Program Participation, have previously ended this practice. Beginning with the 2018 Current Population Survey Annual Social and Economic Supplement (which reports data for calendar year 2017), the Census Bureau is scheduled to implement new editing procedures — reporting marital status consistent with survey responses to the marital status question regardless of whether the married couple is same sex or different sex.
The distinction in treating respondents as same-sex married couples versus same-sex unmarried partners has important implications for the calculation of poverty rates for families. Given that the survey’s supplement is the official source of national poverty statistics, analysts at the Census Bureau are working to educate the public about how these proposed changes would affect poverty measures.
Why do the definitions of family matter when measuring poverty? Poverty status is assigned at the family level — comparing total family income to an assigned poverty threshold that varies by family size and composition. Spouses who report being in an opposite sex marriage are treated as one family, with a 2015 poverty threshold of $15,871. Both spouses’ incomes then contribute towards meeting that family threshold.
Alternatively, when respondents report being in a same-sex marriage, they are reassigned as unmarried partners and treated as two unrelated individuals for the purpose of assigning poverty status. As a consequence of being treated as separate families, their personal incomes must independently meet their individual poverty thresholds of $12,331 per person.
Given that the poverty thresholds assume economies of scale, (i.e., an additional person within a family requires fewer resources than a single individual living alone) annual poverty thresholds for opposite-sex married couples organized as one family are lower than the thresholds across two separate families containing the same number of people. Consider the poverty threshold for the opposite-sex married couple is $15,871, compared to two times the individual thresholds assigned to the same-sex unmarried partners ($12,331 × 2 = $24,662).
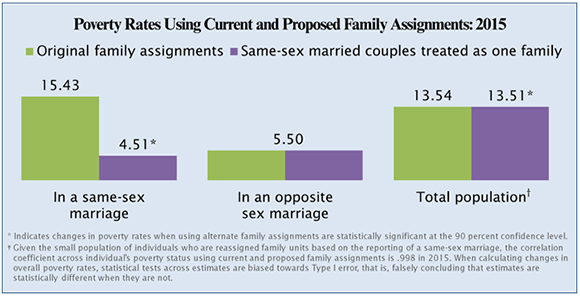
When individuals in same-sex marriages are treated as unmarried partners, their poverty rates vary dramatically from those who report being in an opposite-sex marriage. Looking at the figure below, in 2015, the official poverty rate (green) for individuals who reported being in a same-sex marriage was 15.4 percent, a full 9.9 percentage points higher than individuals in opposite-sex marriages (5.5 percent).

When treating same-sex married couples as one family (purple) consistent with opposite-sex married couples, poverty rates for individuals in same-sex marriages drop by 10.9 percentage points to 4.5 percent.
Poverty rates for individuals in opposite-sex marriages (5.5 percent) are unaffected by changes in family assignment for same-sex married couples. Interestingly, we find that when same-sex married couples are assigned to family units consistent with those in opposite-sex marriages, poverty rates for the married population no longer vary statistically based on relationship type. While these changes lead to large reductions in poverty for same-sex spouses, due to the limited number of people in same-sex married families (0.4 percent of all people), the effect on the total population — while statistically significant — was negligible. Overall poverty rates changed by only three one hundredths of a percent, lowering from 13.54 percent to 13.51 percent. The Census Bureau rounds published poverty estimates to the tenth decimal place, where estimates across methods are consistent at 13.5 percent.
To learn more about poverty rates and family assignments, join us at the Population Association of America conference on April 27, 2017.
-X-


