Separate but Unequal: The Nature of Income Inequality in U.S. Metropolitan Statistical Areas
Separate but Unequal: The Nature of Income Inequality in U.S. Metropolitan Statistical Areas
Income inequality as a concept is straightforward. Are there many haves and have-nots or do most people earn close to the same amount of money? However, the measurement of income inequality is not so straightforward.
There are a number of different income inequality metrics available and the choice of a particular metric alters the conclusions about the level of income inequality and the relationship between income inequality and economic well-being. In this poster, Separate but Unequal: The nature of income inequality in U.S. Metropolitan Statistical Areas, eight inequality metrics are calculated and compared with one another in order to examine how the use of a particular metric affects the understanding of economic well-being in 381 U.S. metropolitan statistical areas (MSAs).
We used data from the U.S. Census Bureau’s 2014 American Community Survey to calculate seven after-tax household income inequality metrics. Household after-tax income includes wages and salary income, self-employment income, retirement income, interest and dividends, as well as transfer payments (Supplemental Security Income, Social Security and public assistance) and subtracts federal and state taxes using the National Bureau of Economic Research’s TAXSIM program [PDF <1.0 MB].
We adjust the income variable by the size of the household using a three-parameter equivalence scale and then adjust by MSA cost of living using factors developed by the Bureau of Economic Analysis (BEA). This cost of living adjustment is only necessary when looking at overall income inequality in the United States and not by individual MSAs.
The eight inequality metrics are:
- Gini index — A statistical measure of income inequality ranging from zero, perfect equality, to one, perfect inequality.
- Palma ratio — Ratio of top 10 percent share of total income to lowest 40 percent share of total income.
- Household income ratios of selected percentiles:
- 80-20 ratio — 80th percentile income limit divided by 20th percentile income limit
- 90-10 ratio — 90th percentile income limit divided by 10th percentile income limit
- 90-50 ratio — 90th percentile income limit divided by 50th percentile income limit
- 50-10 ratio — 50th percentile income limit divided by 10th percentile income limit
- 99-90 ratio — 99th percentile income limit divided by 90th percentile income limit
- The eighth metric measures educational inequality, instead of income inequality, using a Gini index based on educational attainment of heads of households who are at least 25 years of age.
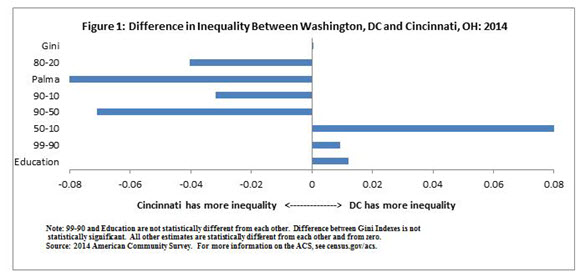
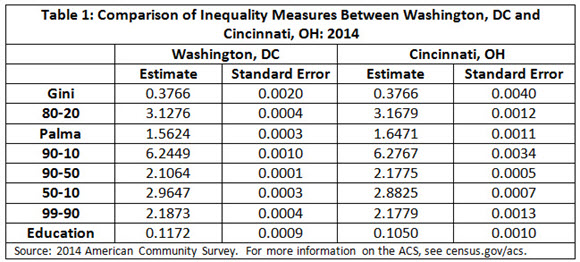
Figure 1 and Table 1 present a comparison of two metro areas in order to illustrate the complexities of measuring inequality. The Gini indexes are not statistically different from one another for Washington, D.C. and Cincinnati, Ohio, while all the other metrics do show statistically significant differences. Furthermore, different metrics lead to different conclusions about which MSA has higher income inequality.
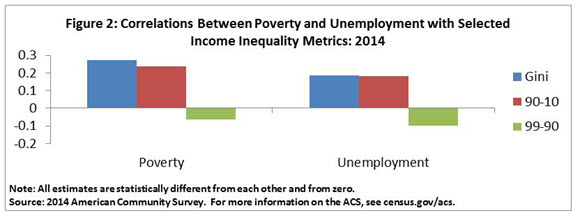
This research allows us to examine the relationship between income inequality and measures of economic well-being across the 381 MSAs. Figure 2 shows the correlation between three income inequality measures and the poverty rate and the unemployment rate across the MSAs. Using the Gini index would lead one to conclude that MSAs with higher income inequality have higher poverty and unemployment. However, income inequality measures focused on just specific parts of the income distribution may lead to different conclusions. For example, the 90-10 ratio also shows correlation between inequality (across the majority of the distribution) and both poverty and unemployment, while a measure focused on the top of the income distribution, the 99-90 ratio, does not.
The main take away from this research is that the choice of and use of a particular income inequality metric has important consequences for the analysis of the level of income inequality and the connection between income inequality and economic well-being among metro areas.


