In What Ways are D.C.-Area Neighborhoods With Rail Transit Different From Other Neighborhoods?
In What Ways are D.C.-Area Neighborhoods With Rail Transit Different From Other Neighborhoods?
A look around the Washington, D.C., metro area reveals a series of neighborhoods with varying demographic profiles. Researchers in the social sciences have produced a rich body of literature illuminating residential patterns for several key demographic characteristics, such as income, race and age across metro areas. A small but growing body of research explores the relationship between neighborhood demographic profiles and the myriad resources and amenities across communities.
A new working paper explores the extent to which the population profile of workers living near rail transit differs from those of other workers within the Washington region. The paper, “Transit Access and Population Change: the Demographic Profiles of Rail-Accessible Neighborhoods in the Washington, D.C. Area,” explores demographic changes in rail-accessible neighborhoods using two American Community Survey (ACS) three-year datasets for comparison, 2006-2008 and 2011-2013. The ACS is an important source of information for research focused on neighborhoods and other community-based analysis.
The analysis includes the six counties or county-equivalents in the region that had at least one Metrorail stop during the study period: Washington, D.C., the city of Alexandria, Va., Arlington and Fairfax counties in Virginia, and Montgomery and Prince George’s counties in Maryland. Workers with rail access are those who live in a census block located within a half-mile from a Metrorail stop.
Findings reveal that young adults, recent movers, white workers, highly educated workers and workers with high earnings all disproportionately live near rail stops in Washington and the five surrounding counties with at least one Metrorail stop.
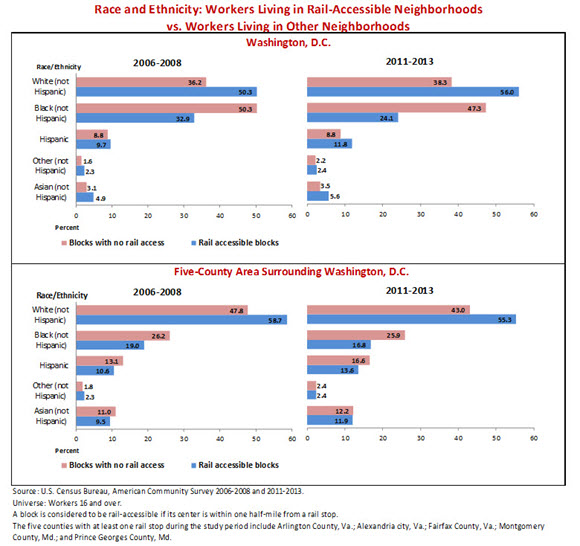
Figure 1 shows that within Washington, white workers are disproportionately represented in neighborhoods near rail stops. For the 2011-2013 period, 56 percent of workers living near rail stops were white, whereas 38.3 percent of workers who did not live near rail stops were white.
Figure 1.
Black workers are underrepresented near rail stops, relative to neighborhoods without rail access. Between 2006-2008 and 2011-2013, the proportion of black workers within rail-accessible neighborhoods declined from 32.9 percent to 24.1 percent, whereas the proportion of all other groups either increased or did not experience a statistically significant change. Unlike their counterparts in Washington, rail-accessible neighborhoods in the five-county surrounding area have a lower proportion of Hispanic workers than do neighborhoods without rail access.
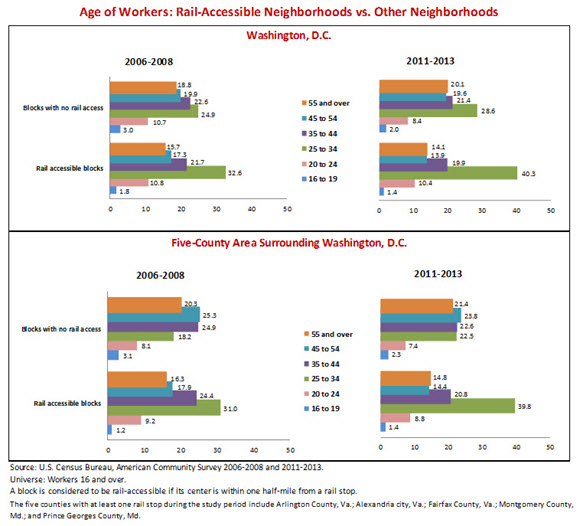
Another finding revealed that younger workers disproportionately reside near rail stops, and their prevalence near rail has increased in recent years. Within Washington and the surrounding areas, about four out of 10 workers living in a rail-accessible neighborhood were between ages 25 and 34 for the 2011-2013 period (see Figure 2). Moreover, between 2006-2008 and 2011-2013, the proportion of workers in this age group increased at similar rates for Washington and the surrounding counties at about 8 percent. Neighborhoods without rail access have a more even distribution of workers across age groups, both in Washington and the surrounding area.
Figure 2.
The presence of a rail stop may play an important role in defining neighborhood characteristics well beyond the central city. Furthermore, the rail-accessible population in Washington is similar to the rail-accessible population of the counties that surround it along several socio-economic indicators, such as age and educational attainment. In both cases, young and highly educated workers disproportionately reside near rail.
It is important to note that the Washington metro area experienced considerable population growth and economic development during the study period. The influx of younger workers into the region may exacerbate competition associated with living near a rail stop, sharpening differences in population profiles between rail-accessible neighborhoods and other neighborhoods. Demographic shifts, changes in the spatial distribution of wealth and changes in the built environment have blurred familiar notions of a rigid “urban” and “suburban” divide in the Washington region and others.
In increasingly complex and diverse metropolitan landscapes, information about how rail stops shape neighborhood identities and boundaries contributes to our understanding of emerging socio-spatial patterns. An improved understanding of such patterns requires examining communities through multiple lenses, including transportation infrastructure.
This paper is available at:
Brian McKenzie, Social, Economic and Housing Statistics Division


