Census Bureau Statistics Allow for Deeper Dive Into Rising Costs of Child Care
Census Bureau Statistics Allow for Deeper Dive Into Rising Costs of Child Care
In the last quarter century, out-of-pocket costs for child care have nearly doubled. During the same period, the types of arrangements that families use have also changed. Results from the Census Bureau’s Survey of Income and Program Participation (SIPP) show us how usage patterns in child care vary over time based on a family’s income.
Adjusting for inflation, families with employed mothers spent $84 per week on average in 1985, which increased by 170 percent to $143 per week in 2011. Since 1997, the use of both organized day care centers and father-provided care increased while the proportion of children in nonrelative care in the provider’s home has decreased.
Recent research suggests that the rise in out-of-pocket costs might be driven by higher income families purchasing more expensive forms of child care typically found in child care centers. Historically, higher income families are also more likely to pay for child care services.
Publication
Beyond differences in who pays for child care and how much is paid, SIPP provides detailed data on primary child care arrangements from 1993 to 2011 under three categories: families with incomes below poverty, those with incomes between 100 and 199 percent of the federal poverty threshold, and families with incomes at least 200 percent of the federal poverty threshold. For ease of discussion, we will refer to these groups as poor, low-to-moderate, and moderate-to-high income families, respectively.
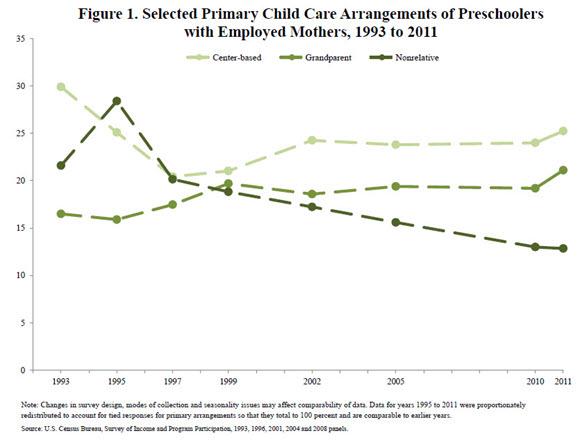
Below, in Figure 1, we explore trends in three commonly used primary child care arrangements by family income: grandparent care, center-based care and nonrelative child care. Historical data on other types of primary arrangements for children under 5 can be found on census.gov. The primary child care arrangement is defined as the arrangement that children spent the most time in on a regular basis.
Figure 1 presents data on selected primary child care arrangements of preschoolers with employed mothers between 1993 and 2011, regardless of family income. Since 1997, the use of center-based care has increased while the proportion of children in nonrelative care decreased. In 1993, 17 percent of preschoolers were primarily cared for by a grandparent, which gradually rose to 21 percent by 2011.
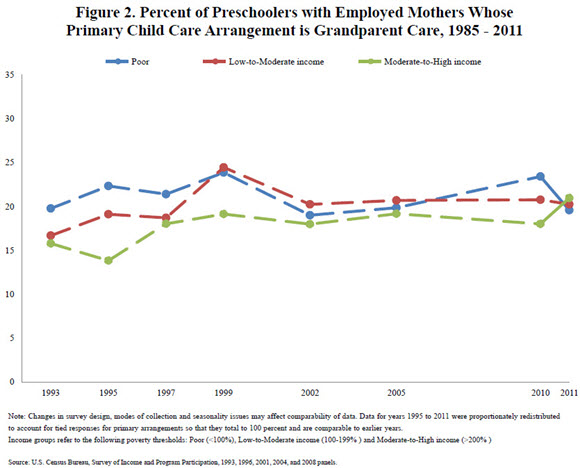
Figure 2 shows the variation in the use of grandparent care between 1993 and 2011 by income status.
It is important to note that poverty thresholds vary by family size and composition. For example, in 2011, a four-person family with two adults and two children was considered poor if their annual household income was less than or equal to $22,350. A family of similar size and composition was considered moderate to high income if their annual household income in 2011 was greater than or equal to $44,700.
Between 1993 and 2011, the rates of grandparent care ranged between 19 to 24 percent for poor families. Peak uses of grandparent care as a primary child care arrangement for this income group occurred in 1999 (24 percent) and 2010 (23 percent). Moreover, rates of grandparent care for low-to-moderate income families fluctuated between 1993 and 1999 and then remained around 20 percent between 2002 and 2011. In 2011, 20 percent of preschoolers living with poor families primarily used grandparent care, which is not statistically different from the rate for low-to-moderate (20 percent) or moderate-to-high income families (21 percent).
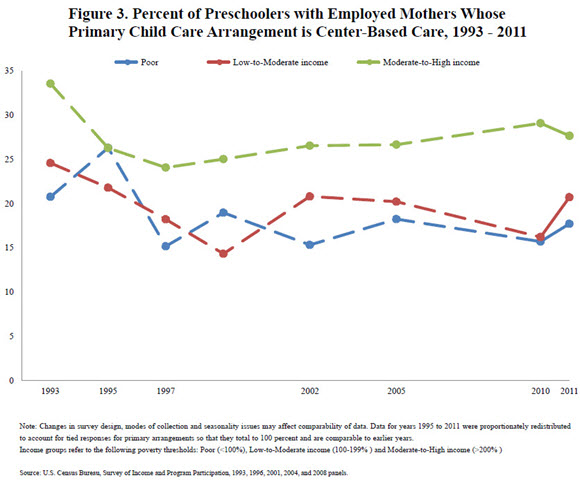
Center-based child care (Figure 3) includes care in a day care center, nursery, preschool or federal Head Start program. With the exception of 1995, moderate to high-income families were more likely to use center-based child care than poor or low-to-moderate income families. While this gap has fluctuated over time, the gap was largest in 2010. Readers should use caution when making comparisons between years because of changes in the SIPP design, such as changes in the number of response options, modes of data collection and seasonality issues related to work schedules and changes in the number of response options for the questions.
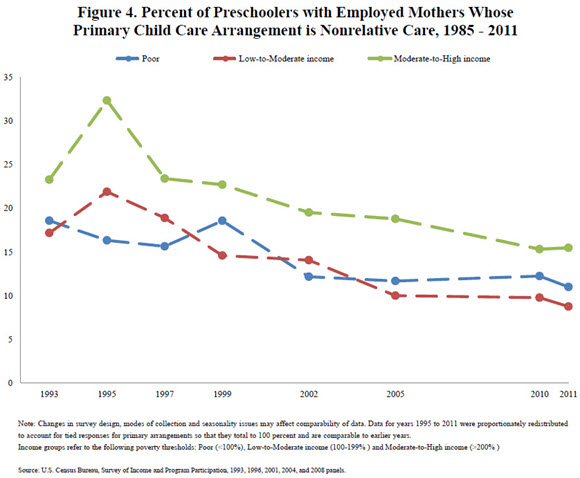
Lastly, nonrelative child care (Figure 4) includes family day care homes or other nonrelative caregivers in the child’s or provider’s home (baby sitters, nannies, etc.). The proportion of children in nonrelative care has decreased for all income groups. Moderate-to-high income families are more likely to use nonrelative care than poor or low-to-moderate income families.
Examining variations in child care usage by family income is just one way of understanding the relationship between child care arrangement type and out-of-pocket child care costs for families. Trends suggest that moderate-to-high income families are more likely than poor or low-to-moderate income families to utilize formal arrangements such as child care centers or family day care homes, arrangements that often require monetary payments.
For more information on child care arrangements, visit census.gov. For further information on the source and accuracy of the estimates, please visit the SIPP Web page.
Lynda L. Laughlin, Fertility and Family Statistics Branch


