
Official websites use .gov
A .gov website belongs to an official government organization in the United States.
Secure .gov websites use HTTPS
A lock (
) or https:// means you’ve safely connected to the .gov website. Share sensitive information only on official, secure websites.

Topics
Data & Maps
Surveys & Programs
Resource Library
Where Did All the Construction Workers Go?
Where Did All the Construction Workers Go?
New Census Data on Job-to-Job Flows
Unfilled job openings in the construction industry have risen steadily since 2009 (Job Openings and Labor Turnover Survey, Bureau of Labor Statistics). The rise follows a sharp fall due to the housing bust and the subsequent Great Recession (Job Openings and Labor Turnover Survey, Bureau of Labor Statistics). Anecdotally, many builders and contractors have reported difficulty finding new workers. While not necessarily indicating a shortage in the market for construction workers, it is possible that tightening labor markets in construction are a drag on employment recovery in this sector. This post sheds light on the labor market in construction using new Census Bureau Job-to-Job Flows data.
Specifically, we investigate the dynamics of worker flows in the construction industry in an attempt to examine some possible causes of this recent tightening in the labor market. We find that over 60 percent of construction workers displaced by the housing bust are employed in other industries or have left the labor market by 2013. We also find evidence of a persistent drop in hiring of younger workers into construction jobs over the last decade that is likely contributing to the current shortage of skilled workers in construction.
We first look at cross-industry job flows to see if construction workers moved into other industries after the housing boom. Figure 1 shows the sources of net employment growth in the construction industry from the second quarter of 2000 to the fourth quarter of 2013. Net employment growth in construction is employment gained or lost from workers moving in and out of construction (black line in Figure 1) due to workers switching industries (blue dashed line in Figure 1) and workers moving in and out of employment (red dotted line in Figure 1).
Employed workers moving from other industries into construction fueled a large part of construction employment growth during the housing boom. However, when the boom ended in 2006, there was no corresponding employment decline from workers moving into other industries; almost the entire employment decline is workers separating to nonemployment.
Which industries fueled employment growth in construction during the housing boom?
Figure 2 shows net flows into construction due to industry switching (blue dashed line in Figure 1) by industry. Workers moving from manufacturing, mining and especially leisure/hospitality jobs fueled much of the employment growth in construction between 2003 and 2005. Flows from leisure/hospitality jobs are especially large — about half of employment growth during the construction boom came from workers moving from leisure/hospitality into construction. These flows are likely driven by pay differentials between the two industries: average worker earnings in leisure/hospitality jobs are lower than in the construction sector. When the industry contracted sharply after the housing crash, that pipeline reversed (i.e. net flows between construction and leisure/hospitality became negative), but only for a few quarters.
Figure 1: Net Employment Change in Construction: Industry Switchers and Workers Moving In and Out of Employment: 2000Q2 – 2013Q4
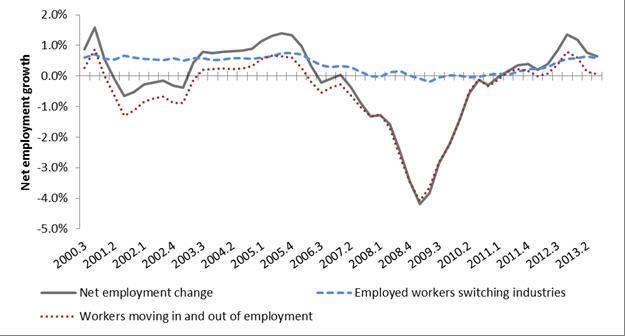
Source: U.S. Census Bureau, beta Job-to-Job Flows (J2J) data, seasonally adjusted, 2014 Q4 release, set of 32 states with complete data from 2000 Q2 to 2013 Q4. "Employed Workers Switching Industries" shows the net job reallocation between construction and other industries from workers changing jobs with little to no employment gap (less than one quarter) between job spells. "Workers Moving In and Out of Employment" shows net employment change in construction from workers moving in and out of longer nonemployment spells (one quarter or more).
One hypothesis for the lack of more sustained worker flows from construction to leisure/hospitality jobs during the Great Recession is the differences in average workers earnings across these two industries. In particular, workers might conduct longer searches or wait out the housing crash rather than go “back down the job ladder” into lower paying work.
Another hypothesis is the relative lack of job security in leisure/hospitality jobs compared with jobs in other sectors. If service sector workers were more likely to lose their jobs in the housing crash and the Great Recession, then construction workers might have less of an incentive to look for jobs in that sector. Consequently, flows of former construction workers back to leisure/hospitality are not as large as one might expect given the long period of inflows from that sector into construction in the preceding years.
Figure 2: Net Employment Change in Construction from Workers Changing Industries: 2000Q2 – 2013Q4
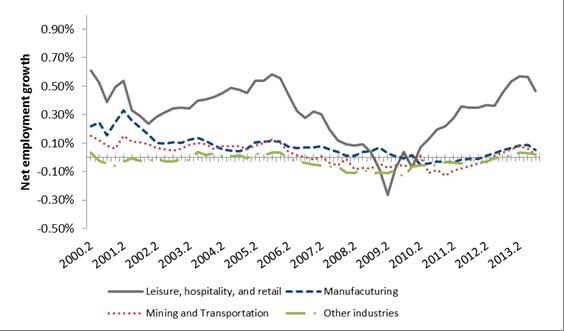
Source: U.S. Census Bureau, 2015Q2 beta Job-to-Job Flows (J2J) data, set of 32 states with complete data from 2000 Q2 to 2013 Q4. Data are seasonally adjusted. This graph shows net employment reallocation in construction from workers switching industries with little to no employment gap (less than one quarter) between job spells.
What happened to construction workers who entered long nonemployment spells during 2006 to 2009?
The Job-to-Job Flows public-use data do not release outcomes for workers who experienced employment gaps of longer than one-quarter, but we can look to the underlying longitudinal microdata for an answer. For construction workers who entered nonemployment spells of more than three months between 2006 and 2009:
- About 40 percent were either recalled to their previous employer or eventually found another construction job.
- Approximately one-third began work in another industry, typically after an employment gap of over a year. The most common destination jobs for these workers are in the trade/transportation and business services sectors. A look at destination jobs by detailed industry suggests many became general laborers, some landscapers, and some truck drivers. Despite the boom in mining during this period, mining accounts for less than 5 percent of new jobs for former construction workers exiting nonemployment.
- Approximately one-quarter of displaced construction workers have no observed subsequent employment by the end of 2013, five to seven years after displacement. These individuals presumably have left the labor market, although they could be working informally or be self-employed.
Figure 3: Hires of Younger Workers as a Percent of All Hires in Construction 2000Q1 – 2013Q4
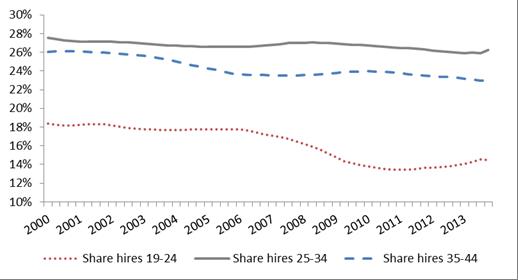
Source: Author's calculations from U.S. Census Bureau's National Quarterly Workforce Indicators (QWI), 2015Q1 vintage. Data are seasonally adjusted and shares are smoothed using a centered moving average.
Another reason construction firms may have trouble finding skilled workers today is that hiring of young workers in the industry declined after the housing boom. Overall, hires of workers less than 45 years old fell from 73% of construction hires in 2000 to 63% in 2011.
To examine this reason in more detail, we turn to the Quarterly Workforce Indicators data. Figure 3 shows the composition of hires into construction jobs by worker age among younger workers. A striking feature of this figure is a marked decline in the share of total hiring from the 19-24 age group. In particular, the percent of hires accounted for by the 19-25 age group declined from approximately 18 percent at its peak before 2006 to 13 percent in 2012-2013. In comparison, the composition of hires of workers in the 25-34 and 34-44 age groups shows much more modest declines over this time period.
The age 19-24 demographic group of workers is particularly relevant since the participation of that age group in industries other than construction has remained constant at approximately 15 percent throughout this period (Figure 4). In other words, the decline in hires among younger workers in the construction industry is not because of a delayed entrance of 19- to 24-year-olds into the labor market, but rather the entrance of these workers into other industries. One reason for this decline could be unwillingness by construction companies to train relatively young workers relative to other industries in the economy. Another reason for this decline could be unwillingness to hire or work for short-duration contract jobs. Note in Figure 4 that young workers (19-24 age group) are being replaced with workers in the age 45-55 category. This increase in percent of 45- to 55-year-olds employed in the construction sector exceeds the employment share of this age group in all industries.
Figure 4: Decomposing Workforce by Age: Construction versus All Industries, 2000Q1 – 2013Q4
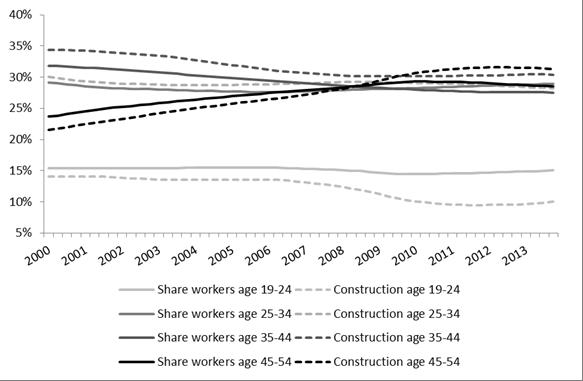
Source: Author's calculations from U.S. Census Bureau's National Quarterly Workforce Indicators (QWI), 2015Q1 vintage. Shares are smoothed using a centered moving average.
In short, our analysis of the data suggests that 60 percent of displaced construction workers have left the labor market or moved into other industries. Although some former construction workers transitioned quickly to other sectors, for most, a move into another industry occurred after a long spell of nonemployment. Also likely contributing to a shortage of experienced workers is a shift in hiring preferences — during the downturn construction firms hired fewer young workers, fewer young workers gained experience in the industry, and the share of older workers grew faster than in other industries.
You can use these data sources to carry out a more detailed analysis. Job-to-Job Flows Beta release data and Quarterly Workforce Indicators data are available for download through the Longitudinal Employer-Household Dynamics program at //lehd.ces.census.gov/data/.
Page Last Revised - December 16, 2021
✕
Is this page helpful?
 Yes
Yes
 No
No
 Yes
Yes
 No
No✕
NO THANKS
255 characters maximum
 255 characters maximum reached
✕
Thank you for your feedback.
Comments or suggestions?

Comments or suggestions?