
Official websites use .gov
A .gov website belongs to an official government organization in the United States.
Secure .gov websites use HTTPS
A lock (
) or https:// means you’ve safely connected to the .gov website. Share sensitive information only on official, secure websites.

Topics
Data & Maps
Surveys & Programs
Resource Library
How Did People Experience Poverty from 2009 to 2012?
How Did People Experience Poverty from 2009 to 2012?
Note: Census Bureau experts are presenting on a variety of topics at the Population Association of America annual conference. Follow the Research Matters blog or visit the press kit to learn more about their work.
Typical poverty statistics are a snapshot of the population in poverty at the time of the survey. Are the poor young or old? Single-parents, in large families, or childless? New estimates highlight an easy-to-overlook aspect of poverty: It is not a constant and individuals move in and out of poverty. Data from the Survey of Income and Program Participation allowed me to estimate the median length of time individuals spent in poverty between 2009 and 2012 as well as the number of times individuals shifted in and out of poverty. The data highlight the diverse poverty experiences of different demographic groups in the early years of the current economic recovery.
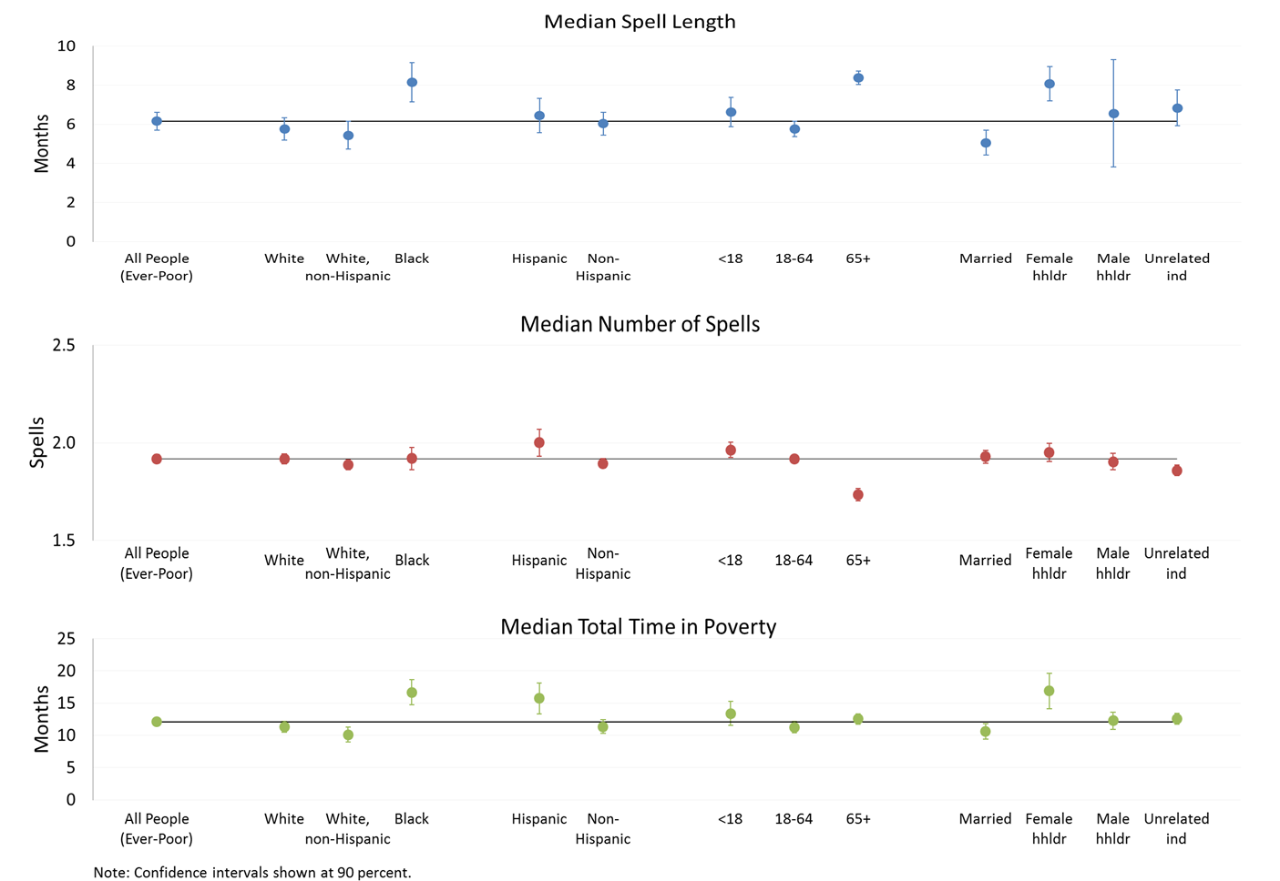
Of individuals who entered poverty at some point between 2009 and 2012, the median length of a poverty spell was 6.2 months. However, some individuals experienced repeated poverty spells, and measures based on spell length failed to account for the often cyclical nature of poverty. Over this four-year period, more than half (54.5 percent) of individuals who entered poverty experienced only a single spell, while 45.5 percent had two or more poverty spells.
My research shows children under the age of 18 and Hispanics tended to experience more poverty spells than the overall population experiencing poverty from 2009 to 2012. Individuals age 65 and older experienced fewer and longer poverty spells, but their median total time in poverty was not statistically different from the overall ever-poor population.
Blacks and individuals in female-householder families did not experience more frequent poverty spells, but their median spell lengths were longer. In contrast, Hispanics experienced more poverty spells, but their individual spell lengths were not any longer than the ever-poor.
Title of Graph – Selected Family and Demographic Characteristics by Poverty Spell Frequency and Duration: 2009 to 2012
Initiated in 1983, the Survey of Income and Program Participation provides a wealth of information to analyze the economic situation of people in the United States. It offers detailed information on cash and noncash income, while also collecting data on taxes, assets, liabilities and participation in government transfer programs. The data allow the government to evaluate the effectiveness of federal, state and local programs.
The 1982 annual poverty thresholds were used as the base to calculate monthly poverty thresholds during the reference period. These annual thresholds were then divided by 12 and adjusted using the consumer price index for a given reference month to provide a monthly poverty threshold by family size. For example, in January 2009, the monthly poverty threshold for a family of four with two children was $1,784, and in December 2012, the monthly poverty threshold for the same family was $1,940.
Note: The Census Bureau’s Trudi Renwick has conducted related poverty research on the supplemental poverty measure. A poster presented at the Population Association of America annual conference displays the results of using data from the Current Population Survey Annual Social and Economic Supplement to estimate the value of variables not included in the American Community Survey but critical to the production of supplemental poverty measure estimates from the American Community Survey. Her poster examines the effect of government noncash benefits and necessary expenditures on state level supplemental poverty measure rates. See the results of this research at:
Page Last Revised - December 16, 2021
✕
Is this page helpful?
 Yes
Yes
 No
No
 Yes
Yes
 No
No✕
NO THANKS
255 characters maximum
 255 characters maximum reached
✕
Thank you for your feedback.
Comments or suggestions?

Comments or suggestions?