
Official websites use .gov
A .gov website belongs to an official government organization in the United States.
Secure .gov websites use HTTPS
A lock (
) or https:// means you’ve safely connected to the .gov website. Share sensitive information only on official, secure websites.

Topics
Data & Maps
Surveys & Programs
Resource Library
Disparities in Health Insurance Coverage
Disparities in Health Insurance Coverage
Note: Census Bureau experts are presenting on a variety of topics at the Population Association of America annual conference. Follow the Research Matters blog or visit the press kit to learn more about their work.
Rates of health insurance coverage vary across population groups. Two recent projects by researchers from the U.S. Census Bureau explore some of these disparities in health insurance coverage.
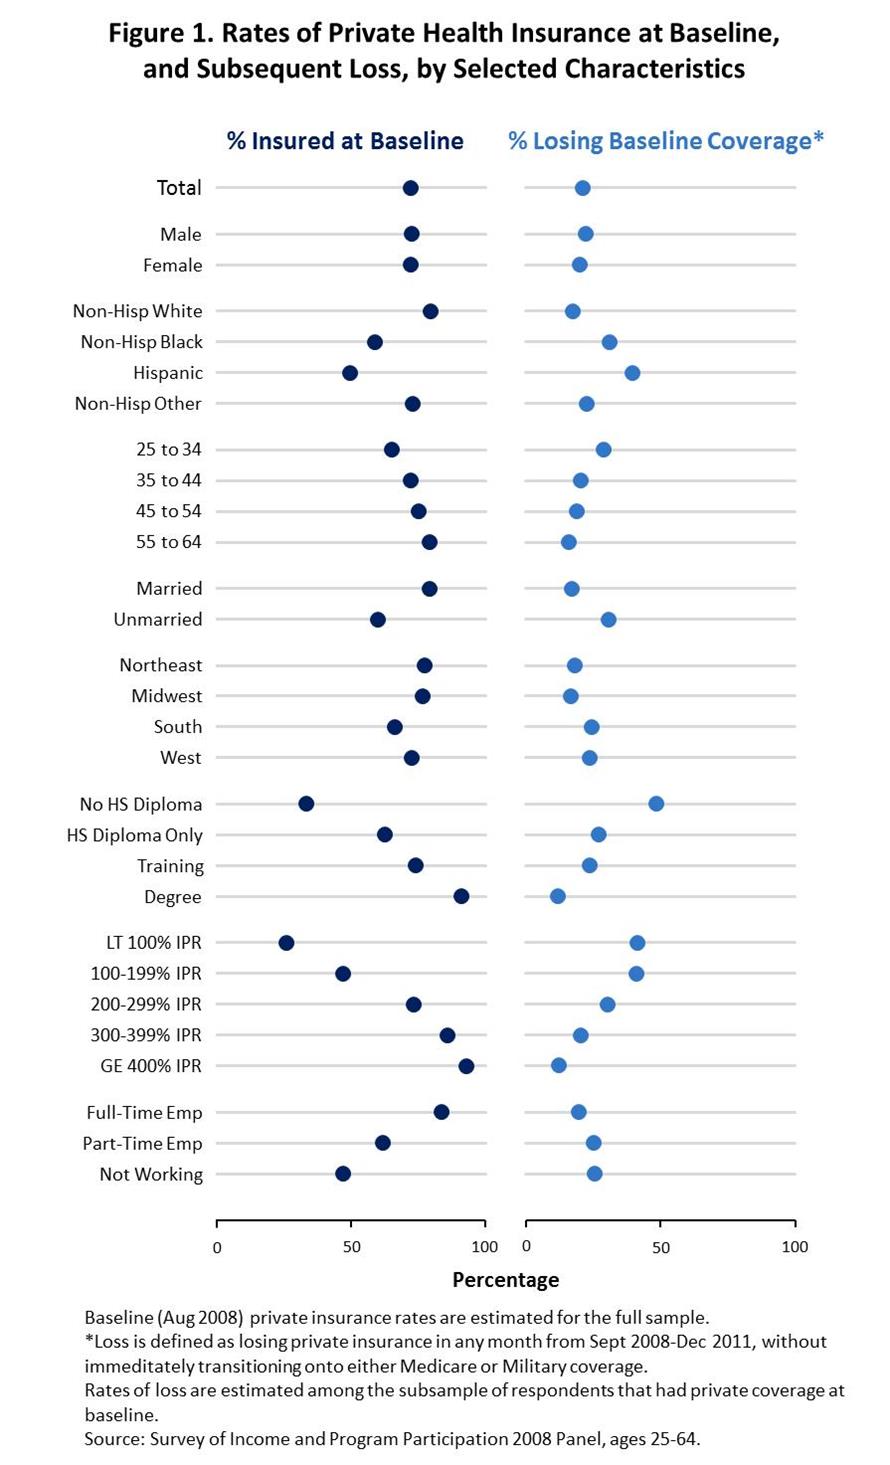
The first project, Disparities in Private Health Insurance Loss in the Wake of the Great Recession, examines which population groups lost their private health insurance coverage after the 2007-2009 recession. Data from the 2008 panel of the Survey of Income and Program Participation show that many groups who were less likely to have coverage during the recession were also more likely to lose that coverage by December of 2011.
Disparities across many demographic and socioeconomic groups may have grown over the 2008-2011 period. For example, in August 2008, 79.4 percent of non-Hispanic Whites had private health insurance compared with only 59.1 percent of non-Hispanic Blacks (see Figure 1). Of those who had private health insurance initially, rates of coverage loss were nearly twice as high for non-Hispanic Blacks as for non-Hispanic Whites. In other words, during this time, non-Hispanic Blacks were less likely to have private health insurance initially, and then more likely to lose that coverage subsequently.
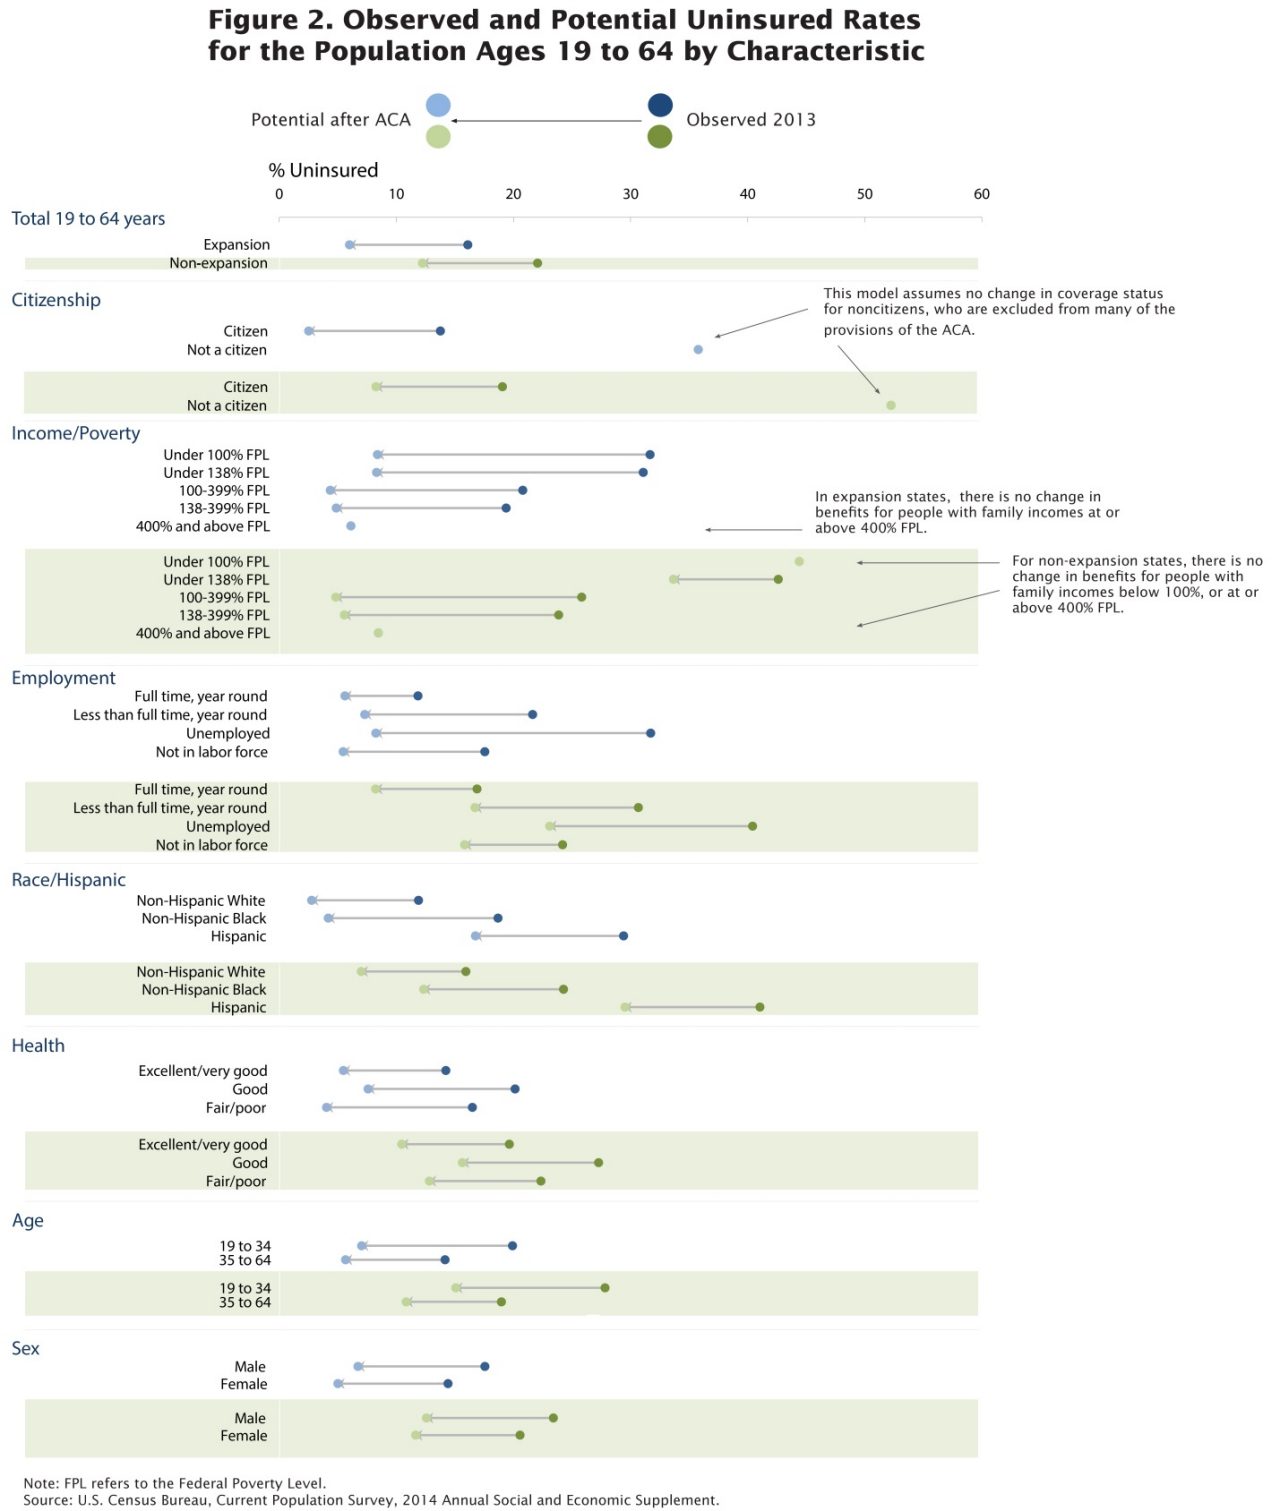
A second project explores whether the Patient Protection and Affordable Care Act has the potential to reduce health insurance coverage disparities across demographic groups. This project, Health Insurance Disparities and the Affordable Care Act: Where Could Inequality Decline?, uses data from the Current Population Survey Annual Social and Economic Supplement to examine current and potential future gaps in the uninsured rate.
The results suggest that disparities may decrease with the change in the law and may decrease more in states that expanded Medicaid eligibility. For example, in 2013, in states that would go on to expand Medicaid, 12.2 percent of non-Hispanic Whites and 18.9 percent of non-Hispanic Blacks were uninsured (see Figure 2). If all eligible uninsured individuals took advantage of new coverage options through the Affordable Care Act, the uninsured rate could decrease for both groups, and the coverage gap between non-Hispanic Blacks and non-Hispanic Whites could be largely reduced. At the same time, in non-expansion states, while both groups could benefit from the Affordable Care Act, the coverage gap could be reduced but not closed.
This research establishes a benchmark to evaluate how closely future changes in the uninsured rate associated with the Affordable Care Act meet the potential for bridging disparities.
To learn more about these projects, visit //www.census.gov/hhes/www/hlthins/
Amy Steinweg and Carla Medalia, Statisticians, Social, Economic, and Housing Statistics Division
Page Last Revised - December 16, 2021
✕
Is this page helpful?
 Yes
Yes
 No
No
 Yes
Yes
 No
No✕
NO THANKS
255 characters maximum
 255 characters maximum reached
✕
Thank you for your feedback.
Comments or suggestions?

Comments or suggestions?