
Official websites use .gov
A .gov website belongs to an official government organization in the United States.
Secure .gov websites use HTTPS
A lock (
) or https:// means you’ve safely connected to the .gov website. Share sensitive information only on official, secure websites.

Topics
Data & Maps
Surveys & Programs
Resource Library
Geography at the Census Bureau
Geography at the Census Bureau
As a field of study dating from antiquity, geography ranges broadly from the social sciences to the physical sciences and humanities. The Census Bureau’s work in geography is concentrated in the domain of the social sciences and in such methodological subfields as cartography, geographic information systems, and remote sensing.
One of geography’s central questions—Where is it?—is the foundation for the agency’s most fundamental activities. All residences and firms ultimately occupy a particular location or locations, and gains in program efficiency and effectiveness come about in part from detailed understanding of the geography of people and activities. Geography often serves as the organizing dimension for the agency’s data collection, tabulation, presentation, and dissemination.
Collection of Census Bureau data, for example, depends heavily on America’s digital map—TIGER—and using that map more effectively along with the Master Address File is one subject of current research. Recognizing settlement patterns informs strategies for designing samples and directing enumeration to ensure appropriate coverage while minimizing duplication and field interviewers’ travel.
Delineation of statistical areas such as census blocks, tracts, and urban areas is another geographic activity that is crucial to agency data collection and presentation programs and one that has benefited from continued research. A host of questions underlies decisions on qualification of areas, delineating boundaries, and determining when areas have grown together sufficiently to be regarded as a single, larger area.
Finally, reviewing data and then disseminating them in ways that facilitate and encourage their use both gain from geographic insights. Geographers continue to be central to the effective presentation of Census Bureau data, and their work has benefited both identification of potential data problems and discernment of patterns and relationships.
The Census Bureau’s 19th century census atlases were leaders in the field of data presentation. Last decade’s Census Atlas of the United States (see: //www.census.gov/population/www/cen2000/censusatlas/) was the first comprehensive atlas of population and housing produced by the Census Bureau since the 1920s. It contains nearly 800 maps covering topics such as language and ancestry characteristics, housing patterns and the geographic distribution of the population.
The increasing numbers of website applications recently introduced and in preparation for use in reviewing and displaying data require sustained research on mapping best practices for the Census Bureau to continue to excel in this arena.

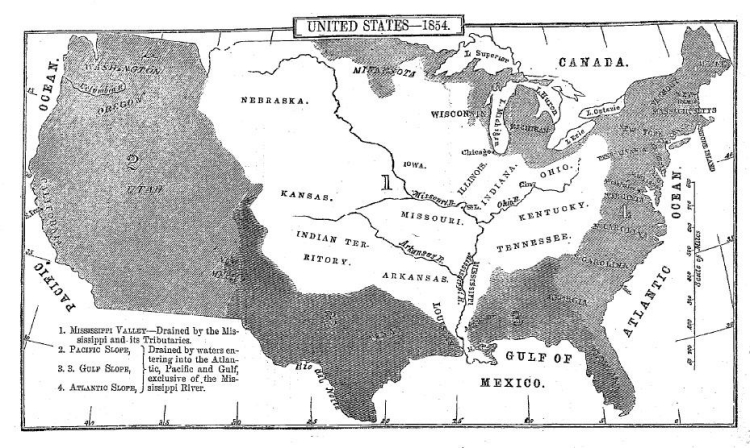
Census Superintendent J.D.B. DeBow published the first map in a census publication in 1854. This map showed his delineation of the United States into four major regions, based on the major drainage systems of North America.

Census Bureau âCenter of Populationâ maps trace the center point of the nation's population starting with the first census in 1790. (See animated historical map: //www.census.gov/geo/www/maps/2010center_pop_animation/2010mean_center_animation.html)
Related Information
VISUALIZATION
U.S. Census Map: 1850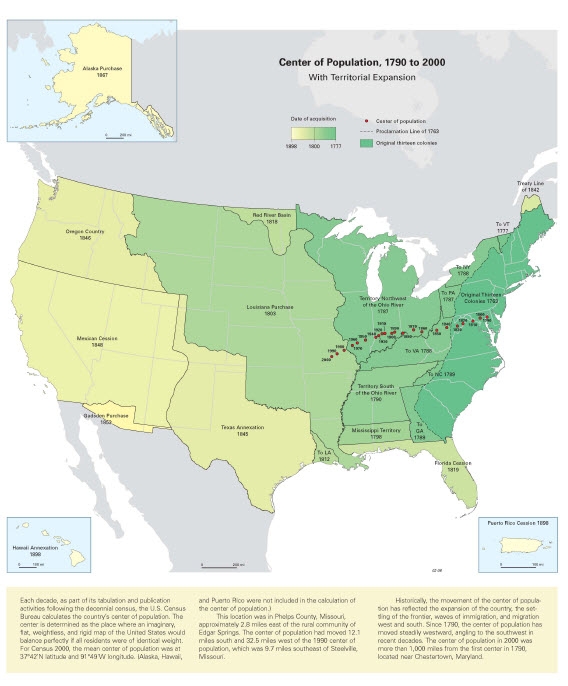
VISUALIZATION
Center of Population, 1790 to 2000
Page Last Revised - December 16, 2021
✕
Is this page helpful?
 Yes
Yes
 No
No
 Yes
Yes
 No
No✕
NO THANKS
255 characters maximum
 255 characters maximum reached
✕
Thank you for your feedback.
Comments or suggestions?

Comments or suggestions?