
Official websites use .gov
A .gov website belongs to an official government organization in the United States.
Secure .gov websites use HTTPS
A lock (
) or https:// means you’ve safely connected to the .gov website. Share sensitive information only on official, secure websites.

Topics
Data & Maps
Surveys & Programs
Resource Library
Age Heaping in the 2020 Census Demographic and Housing Characteristics File (DHC)
Age Heaping in the 2020 Census Demographic and Housing Characteristics File (DHC)
Estimated reading time: 7 minutes
Most people know their own birthday, and even the date of birth for their immediate family members, but what about their roommate’s or neighbor’s age and date of birth?
When people do not know someone’s exact age, they often guess ages that end in 0 or 5. For example, they are more likely to say that someone is 45 or 50 rather than 46 or 49. Demographers refer to this as “age heaping,” and it is a common issue with a census or a survey where people are allowed to report for another household member or even a neighbor.
Today, we are releasing the 2020 Census Demographic and Housing Characteristics File (DHC), which includes the first detailed age results from the 2020 Census. While age heaping is an issue in all decennial census and household survey data, the 2020 Census shows patterns of age heaping that are more pronounced than in prior decades. As we’ll explain below, this age heaping appears to be a result of more proxy responses this decade. It is not related to data processing or disclosure avoidance procedures.
Below is a data visualization that lets you explore the age distributions for the 2000, 2010 and 2020 Censuses.

(Data Visualization: Age Distribution for U.S. Population: 2000, 2010, and 2020 Censuses)
The 2020 Census data show a sawtooth pattern with large spikes in the age distribution starting at age 25 and continuing in 5-year intervals until age 65. We also see spikes in some of these ages in the 2000 and 2010 Census data, but the patterns are not as consistent or as sizable.
There are other fluctuations in the age distributions, but many of these are caused by normal demographic events such as changes in the number of births, deaths or international migration by age for a specific period. For example, the graph clearly shows the aging of the baby boom cohorts (born from 1946 to 1965) over time. The larger population size for these cohorts is something that we would expect to see in the age distribution of the U.S. population.
Measuring Age Heaping
There are several approaches for measuring age heaping in population data. We focused our analysis of the 2020 Census DHC on one called “Whipple’s index.” Whipple’s index is the most common approach used by other national statistical offices and international organizations including the United Nations. Whipple’s index tells us how much the data deviate from an age distribution where there is no preference for ages ending in 0 and 5. (We referenced the great description of Whipple's index from the "Age and Sex Composition" chapter of the authoritative book on demography "The Methods and Materials of Demography.")
The index is typically calculated for the population ages 23 to 62, which most closely matches the age range where we see the heaping in the 2020 Census data.
Here’s how the index works:
- Add up the people with an age ending in 0 and 5.
- Multiply the sum by 5.
- Divide that number by the sum of the total population of ages 23 to 62.
- Multiply the resulting ratio by 100.
- Observe how high the result is above 100 to gauge how much deviation there is from a distribution with no evidence of heaping on 0s and 5s. A lower number signals less age heaping.
Table 1 provides guidelines for interpreting Whipple’s index values.
| Table 1. Whipple’s Index Interpretation Guidance | ||
|---|---|---|
| Whipple's index | Quality of data | Deviation from perfect |
| 0 | No ages ending in 0 and 5 | NA |
| 100 | No preference for ages ending in 0 and 5 | NA |
| < 105 | Highly accurate | < 5% |
| 105–109.9 | Fairly accurate | 5–9.99% |
| 110–124.9 | Approximate | 10–24.99% |
| 125–174.9 | Rough | 25–74.99% |
| ≥ 175 | Very rough | ≥ 75% |
| 500 | All ages end in 0 and 5 | NA |
The Whipple’s index value for the 2020 DHC at the national level is 105.9, which indicates that the age data are fairly accurate or represent a deviation from absolutely no heaping of 5.0% to 9.9%. This is different from the 2000 and 2010 Censuses data where the Whipple’s index values were 101.8 and 102.2, respectively. These values indicate that the age data in 2000 and 2010 were highly accurate or represented a deviation of less than 5.0%.
Age Heaping Is Greater for the Male Population
Using population pyramids and Whipple’s index to analyze age heaping by sex, it is possible to see that age heaping in the 2020 Census is greater for males than for females. Population pyramids are a type of bar graph that shows the population by age for males on one side and females on the other.
We have produced population pyramids with Whipple’s index values for males and females from 1980 to 2020. We encourage readers to explore this data visualization below.

(Data Visualization: Age-Sex Pyramid for the United States)
The population pyramid for the 2020 Census shows age heaping where ages ending in 0 and 5 exhibit large increases relative to the surrounding ages. For example, the bar for age 30 extends out sharply from ages 29 and 31; we see similar patterns for the other ages ending in 0 and 5. Again, demographers would not expect such large increases and decreases at any particular age.
The population pyramid for the 2020 Census shows that there was considerable age heaping for both males and females. The Whipple’s index for males was 106.6 compared to a value of 105.3 for females. This indicates a higher deviation from no heaping for males of 1.3 percentage points. However, both of these values fall in the “fairly accurate” range of the interpretation guidance.
The Quality of Some Reported Ages
The census strives to collect accurate information from every household about the age and date of birth of the people living in the housing unit. If a household doesn’t respond to the census on its own or through an interview with a census taker, we try to get its information from a neighbor, landlord, building manager or other knowledgeable person. We refer to these as “proxy responses.”
The number of housing units enumerated using proxy responses can provide insight into the quality of the census. In the 2020 Census, 26.1% of occupied housing units in the Nonresponse Followup operation were resolved using proxy responses compared to 24.7% in the 2010 Census.
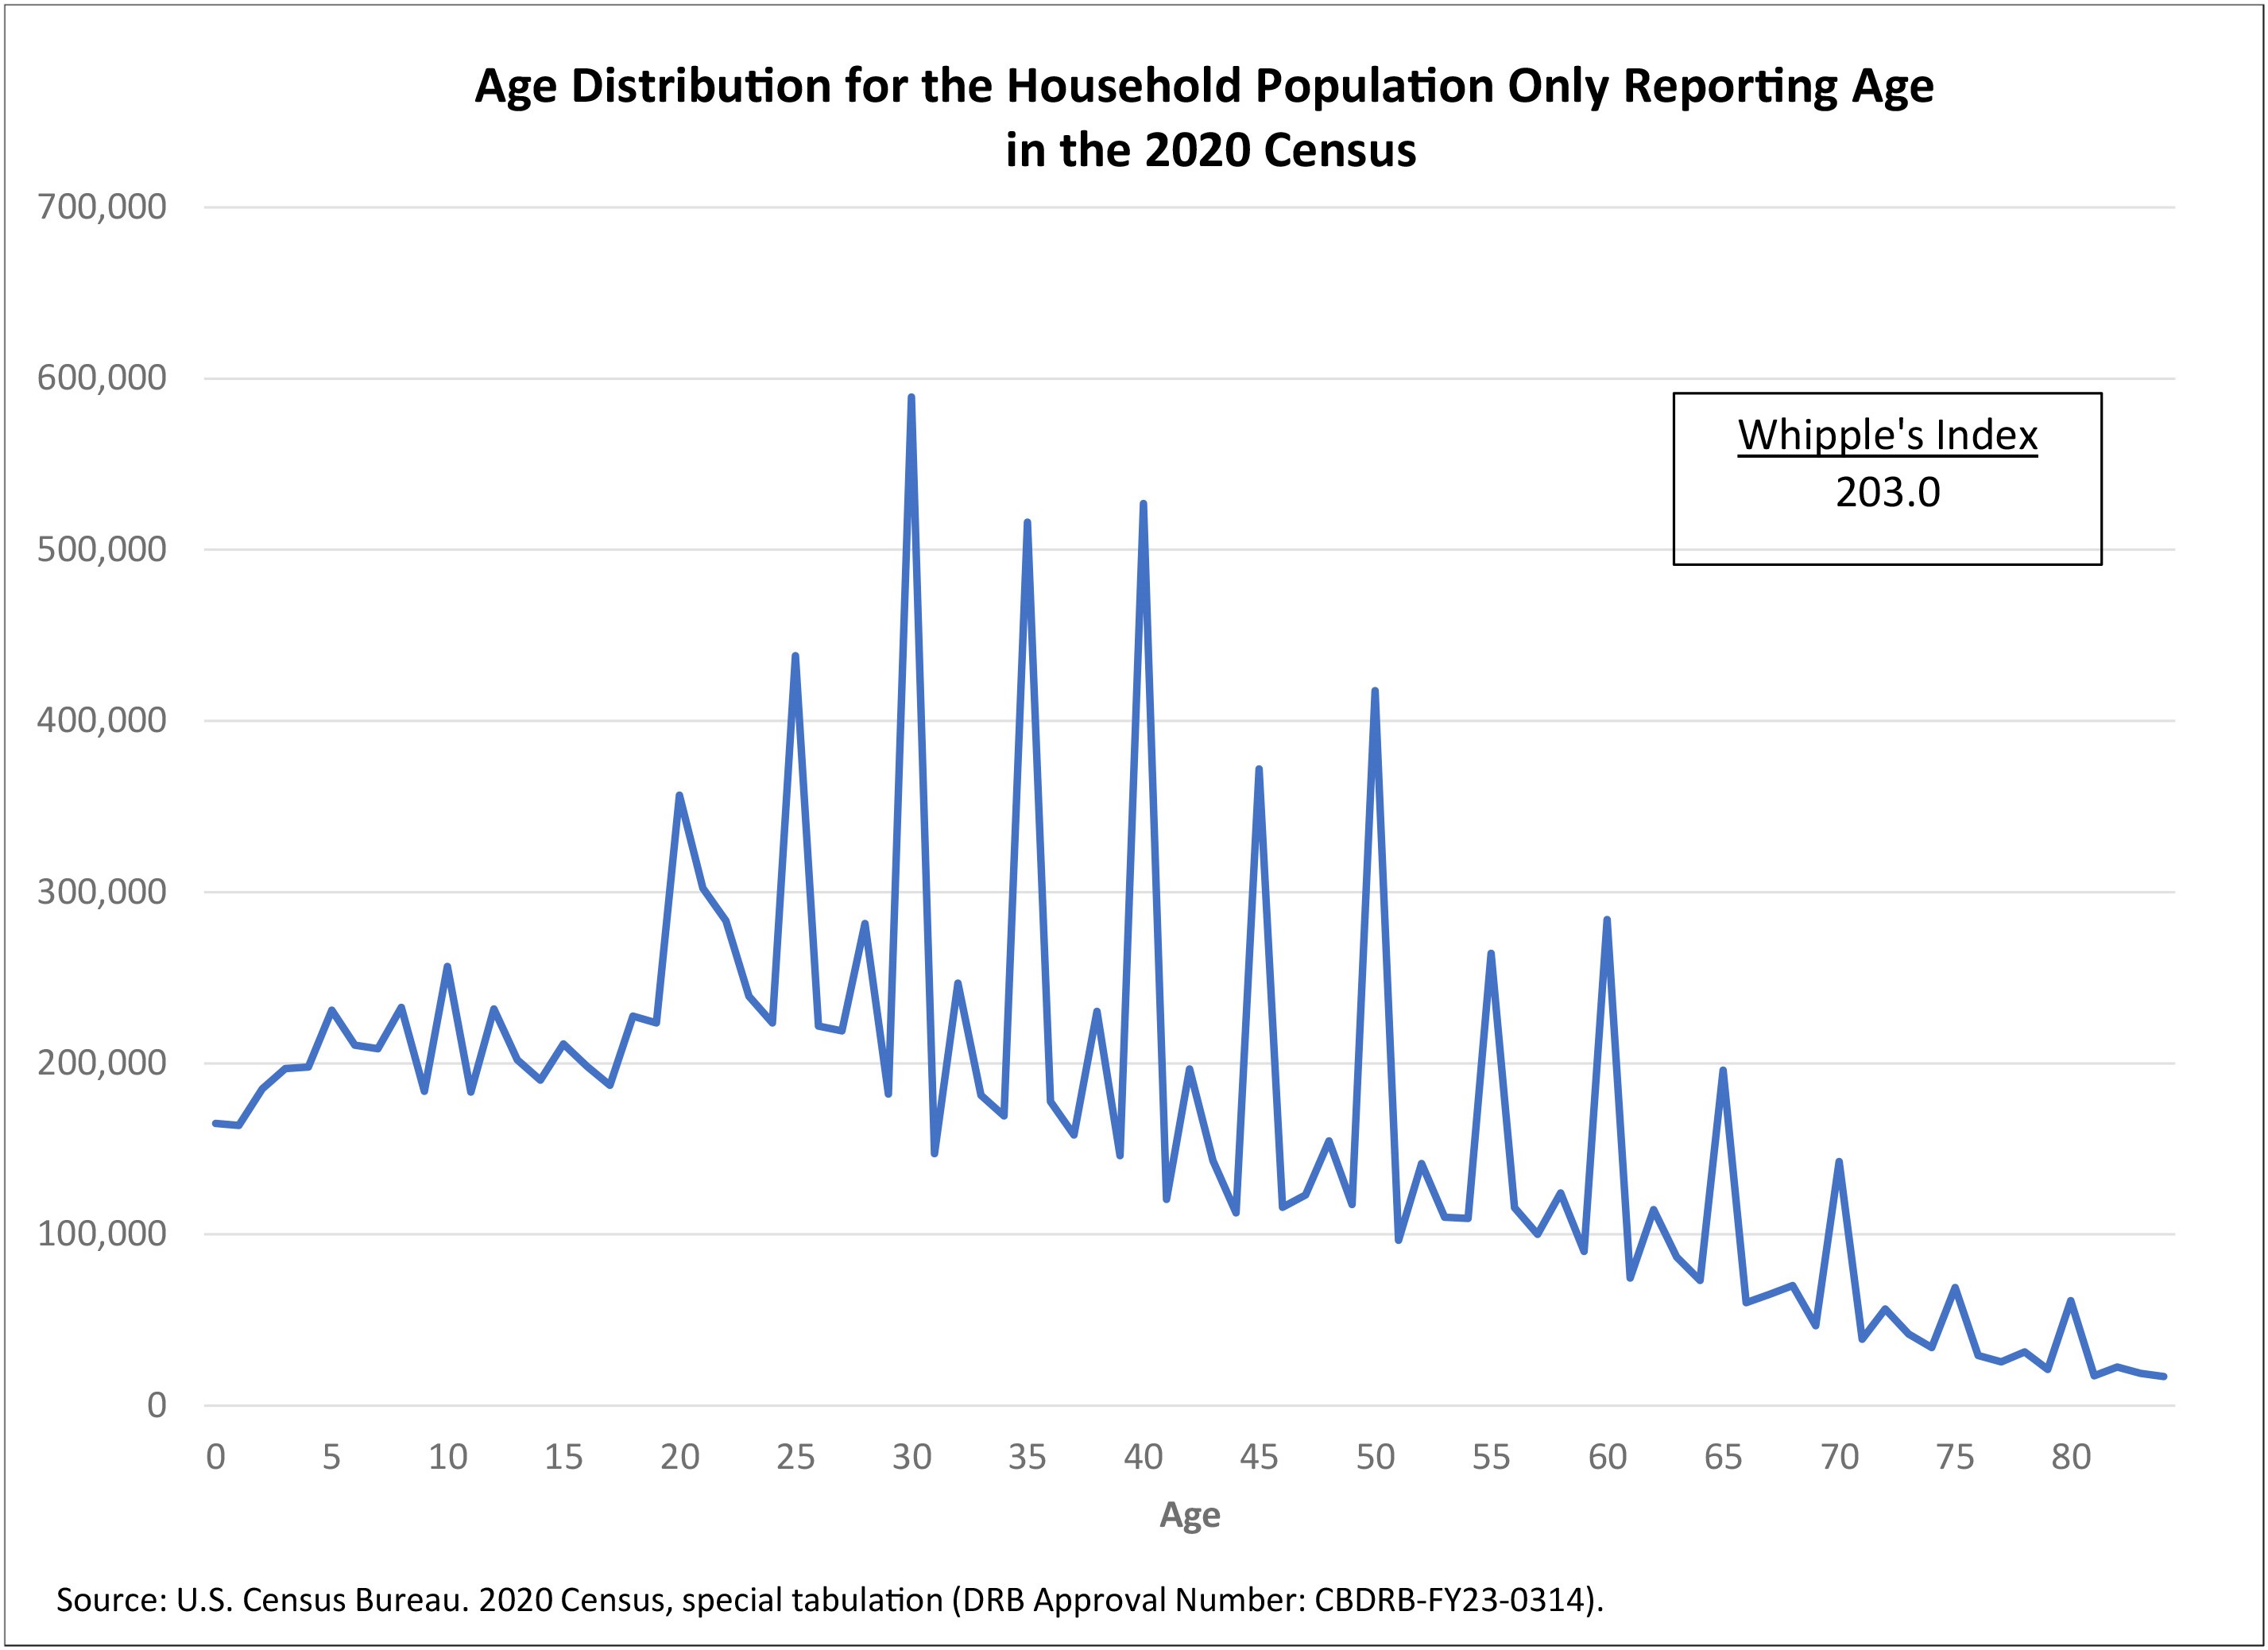
Our research has found that heaping is greatest when people only report an age and do not include a date of birth, especially with proxy reporting. We refer to these as “age-only” responses. This makes sense because if you do not know someone’s exact age, you probably don’t know their date of birth either.
The graphs below show the age distribution for the household population that was age-only — meaning that there was not a date of birth reported — and the age distribution for the household population when we remove the age-only cases. The distribution for the age-only population shows extreme age heaping on values ending in 0 and 5. Whipple’s index for the age-only household population is 203.0 indicating that the data are very rough and represent more than a 100% deviation from an age distribution without any heaping.
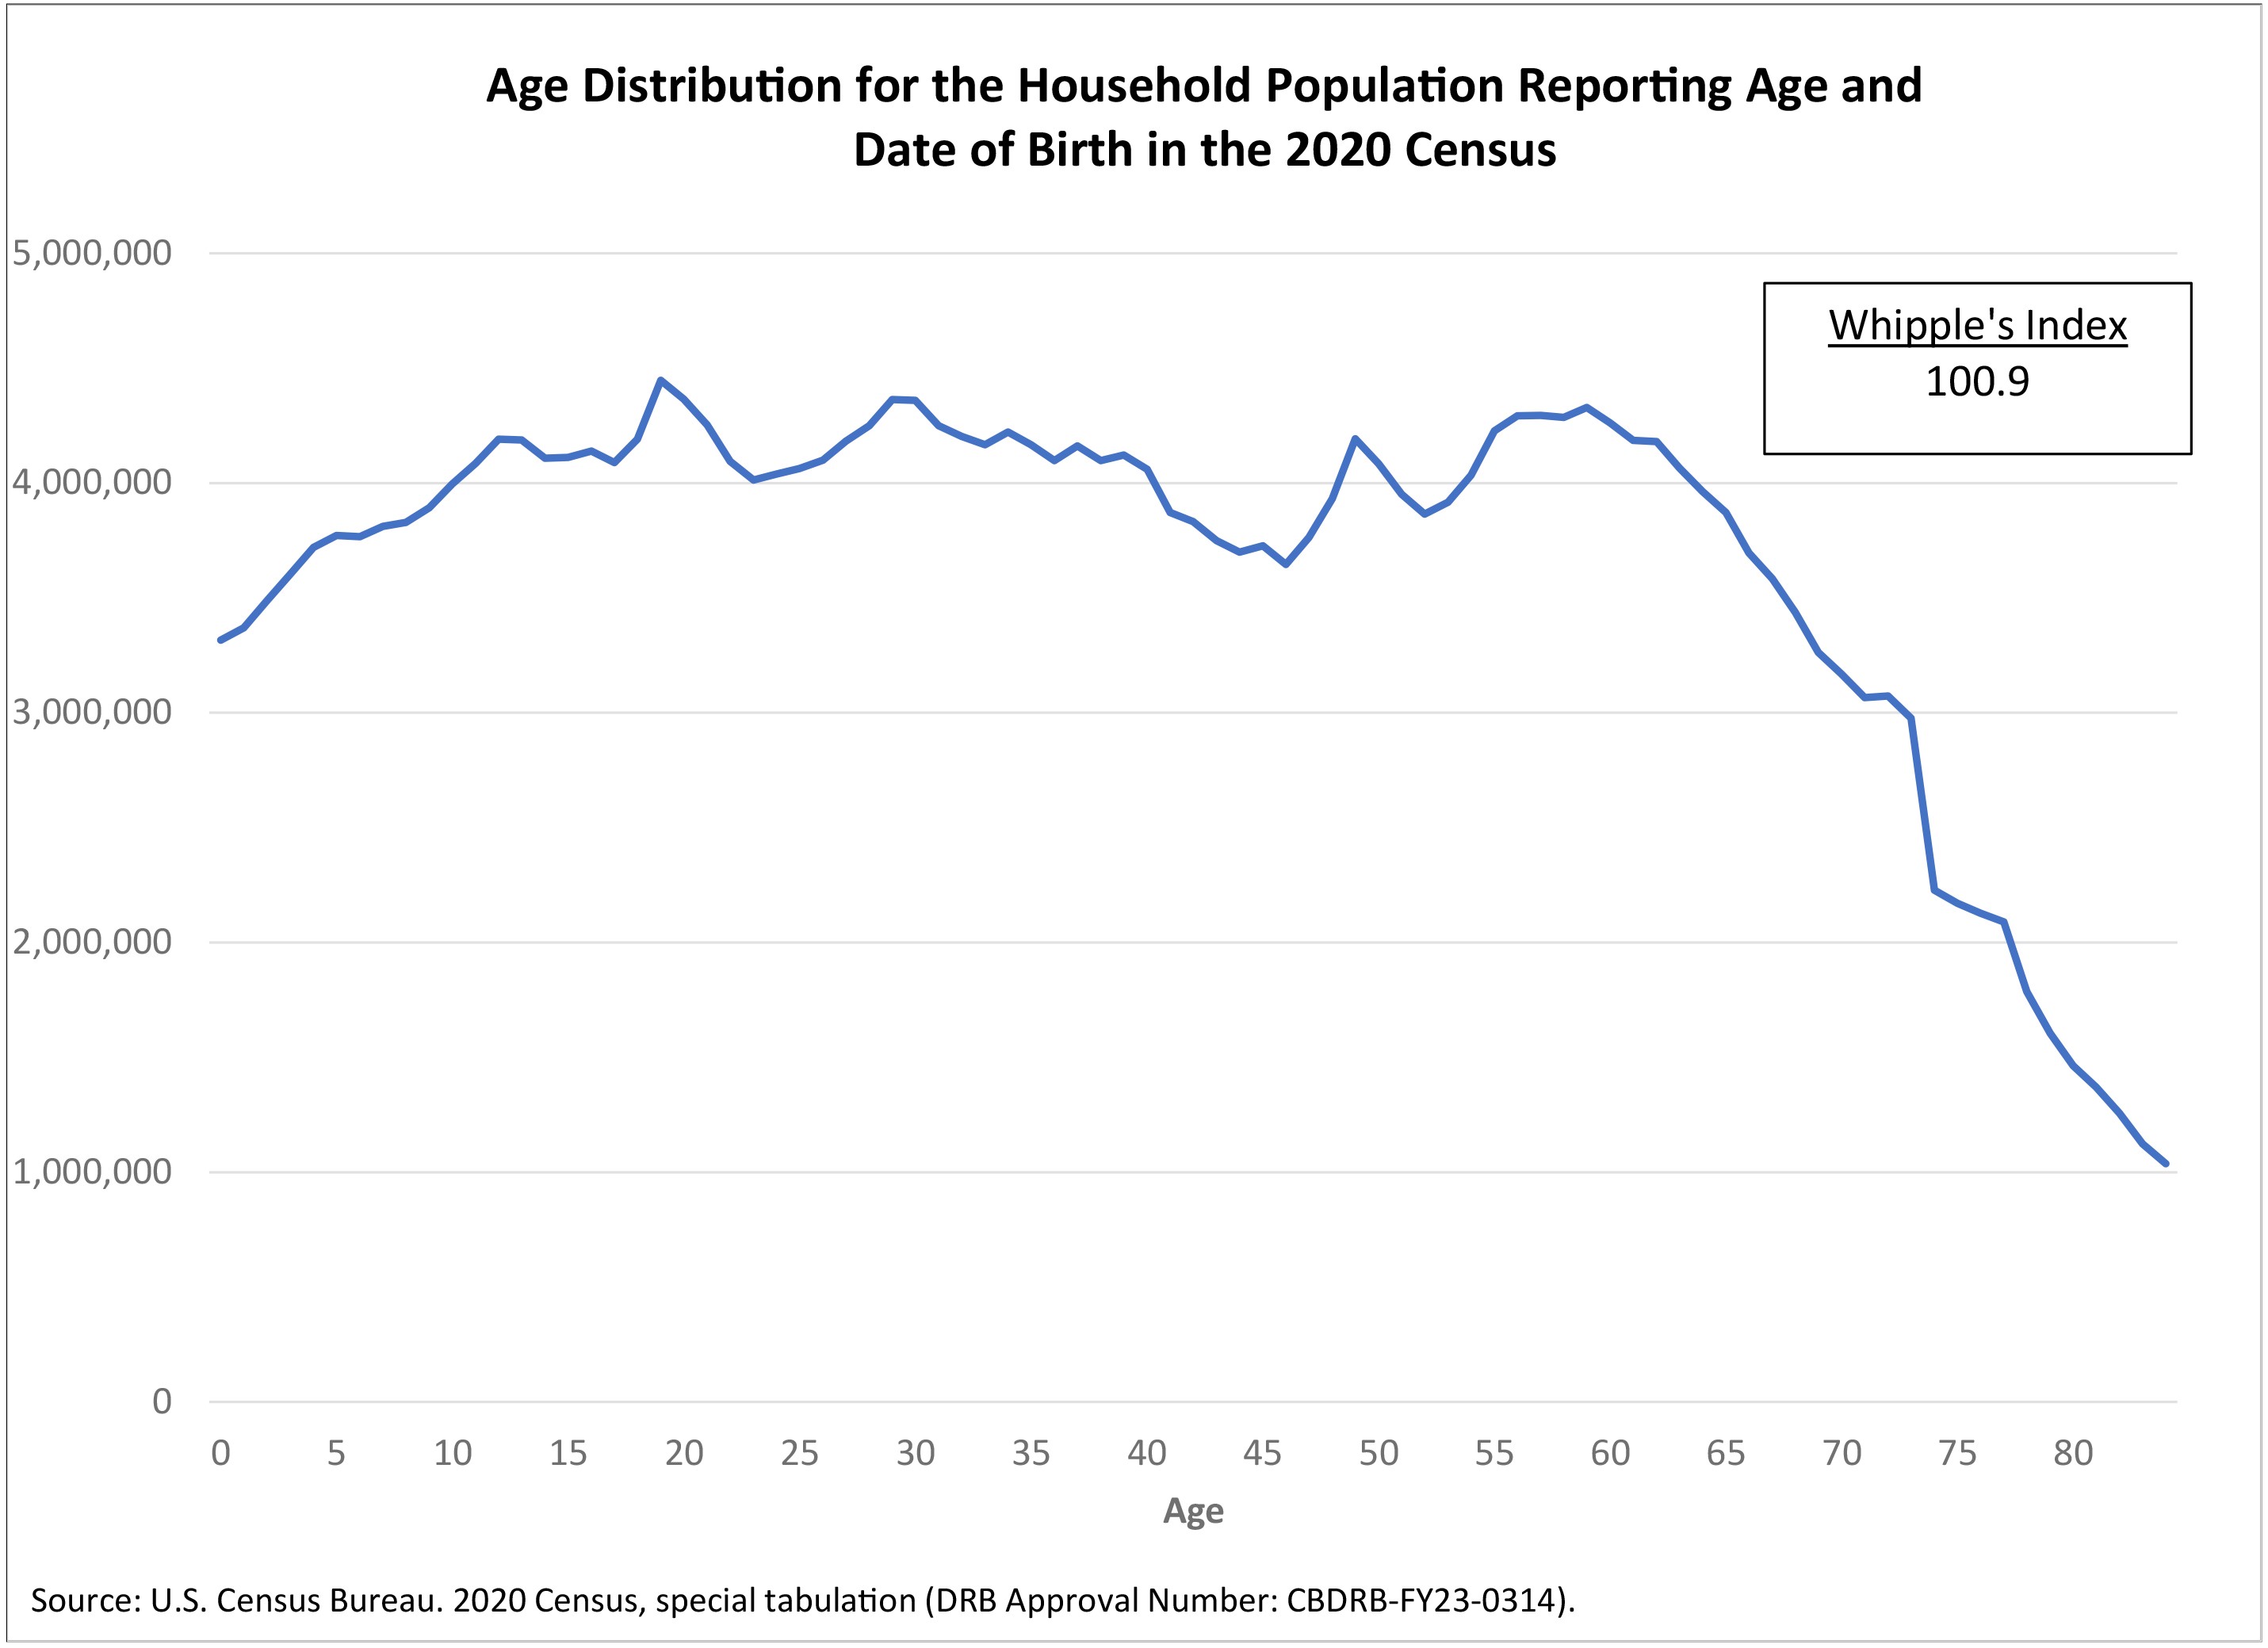
The age distribution for the household population with the age-only cases removed is much smoother with fewer spikes in the data or sudden increases and decreases. Whipple’s index value for this population is 100.9 indicating that the data are highly accurate with almost no deviation from an age distribution without age heaping.
The age-only population is approximately 14.7 million people and the population with the age-only cases removed is 313.3 million people. So while the age heaping for the age-only population is extreme, this accounts for only 4.5% of the total household population in the 2020 Census.
Moving Forward
As noted above, age heaping is an issue in all decennial census data, and the 2020 Census is no exception. As with previous censuses, this is viewed as an artifact of the data, and the Census Bureau does not plan to go back and revise any 2020 Census data products. However, we have been exploring ways to improve the age distribution in other Census Bureau data products, such as our annual population estimates, and applying lessons learned from the 2020 Census in preparation for the 2030 Census.
References
Hobbs, Frank. "Age and sex composition." The Methods and Materials of Demography 2: 125-173. Edited by Jacob S. Siegel and David A. Swanson. California, USA: Elsevier Academic Press, 2004.
Page Last Revised - November 7, 2024
✕
Is this page helpful?
 Yes
Yes
 No
No
 Yes
Yes
 No
No✕
NO THANKS
255 characters maximum
 255 characters maximum reached
✕
Thank you for your feedback.
Comments or suggestions?

Comments or suggestions?