High Frequency Business Survey Highlights Trends in the U.S. Economy: Two Years of the Small Business Pulse Survey
High Frequency Business Survey Highlights Trends in the U.S. Economy: Two Years of the Small Business Pulse Survey
In April 2020, the U.S. Census Bureau launched two new surveys, the Small Business Pulse Survey (SBPS) and the Household Pulse Survey, to produce near real-time data on the challenges small businesses and households were facing due to the Coronavirus pandemic. Two years of data collection has demonstrated the value of the pulse surveys to a vast set of stakeholders including policymakers, state and local governments, nonprofit and trade organizations, businesses, academia, and the public. The Census Bureau will continue to produce high frequency, detailed, near real-time data for businesses beginning mid-August 2022 under the new Business Trends and Outlook Survey (BTOS). The BTOS will build on the success of the SBPS, using similar methodology to capture key economic data in near real time as well as expectations about future business conditions. BTOS will produce biweekly estimates on a continuous basis, initially for all single-location employer businesses in the 50 states, District of Columbia and Puerto Rico which are the same geographies included in SBPS.
The SBPS target population included all nonfarm, single-location employer businesses with fewer than 500 employees and receipts of $1,000 or more. Over 900,000 businesses were included in the initial sample and assigned to one of nine groups. The SBPS was conducted in nine-week phases with each group receiving an email invitation to respond once in each survey phase. Four-week breaks occurred between phases during which no data was collected. Businesses were surveyed in each of the eight phases occurring over the two years of the SBPS. The Census Bureau published weekly SBPS data nationally as well as detailed products including state, sector, subsector, state by sector, select MSA, and employment size class data.[1]
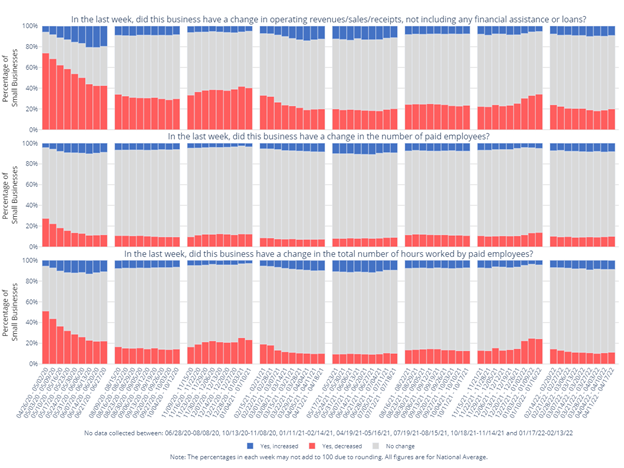
The SBPS captured insight into key economic trends during rapidly changing conditions including the initial shutdowns and reopening of businesses. Figure 1 shows the dramatic and historical employment dynamics of the early months of the pandemic.[2] In the last week of April 2020, approximately 74.0% of businesses reported experiencing a decrease in revenue, approximately 27.5% reported experiencing a decrease in the number of employees at the business, and approximately 51.2% reported experiencing a decrease in the number of hours worked by paid employees in the last week. As stay-at-home orders were lifted and activity resumed, the SBPS captured the improvement in business conditions reflected in the falling “Yes, decreased” categories and increases in the “Yes, increased” categories; this likely also reflects the permanent closure of the worst affected businesses. We see this improvement again in the fourth and fifth phases of the SBPS (Feb. 15-April 18, 2021, and May 17-July 18, 2021) after COVID-19 vaccines became widely available to the public. However, more often over the two years, the improvements in conditions come from a shift in responses from the “Yes, decreased” into the “No change” categories likely reflecting more stable business conditions.
Figure 1. Percentage of Businesses with Changes in Revenue, Employment, and Hours
(Small Business Pulse Survey, April 2020-April 2022)
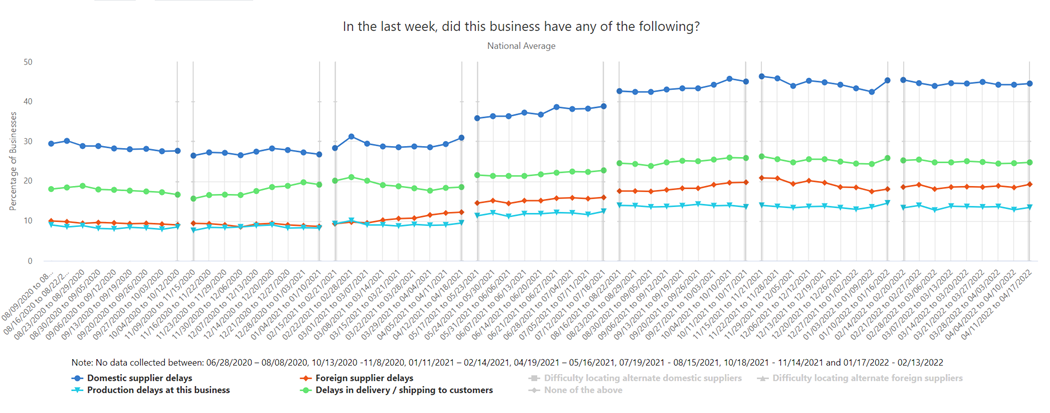
The challenges brought on by the pandemic have led businesses to adjust to new ways of doing business. The SBPS has measured their innovative responses, including changes in their use of online platforms to deliver goods and services, the adoption of contactless delivery of goods, the provision of services over the internet (such as telehealth), and increased remote work or telework by employees. The SBPS captured critical data on the widespread and persistent supply chain difficulties occurring economy wide (Figure 2), shortages of PPE and other inputs for business operations, and the impact of the pandemic on the business’s operating capacity.
Figure 2. Percentage of Businesses with Supply Chain Challenges
(Small Business Pulse Survey, August 2020-April 2022)
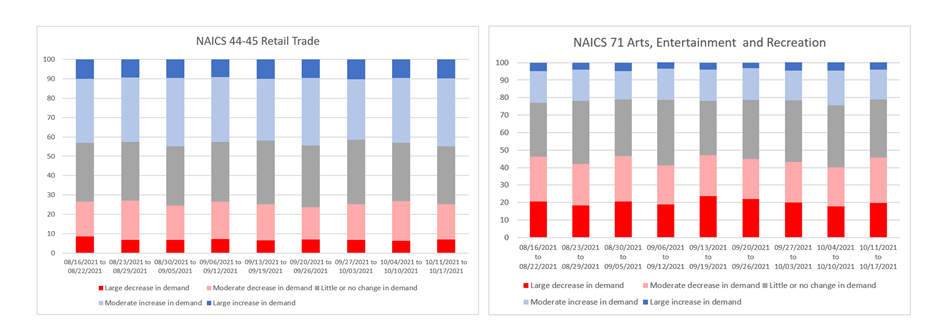
Businesses that produce or sell goods have faced huge increases in demand (for example, Retail Trade in Figure 3), whereas those supplying services that require face to face contact with their customers have seen much more variable changes in the demand for their services since the start of the pandemic (for example, Arts, Entertainment and Recreation in Figure 3). Large and widespread increases in the prices businesses have paid for goods and services since the start of the pandemic are also evident in SBPS data (Figure 4).
Figure 3. Changes in Demand Since the Start of the Pandemic
(Small Business Pulse Survey, August-October 2021)
Figure 4. Changes Since the Start of the Pandemic: Work From Home, Demand and Prices Paid
(Small Business Pulse Survey, January 10-16, 2022)
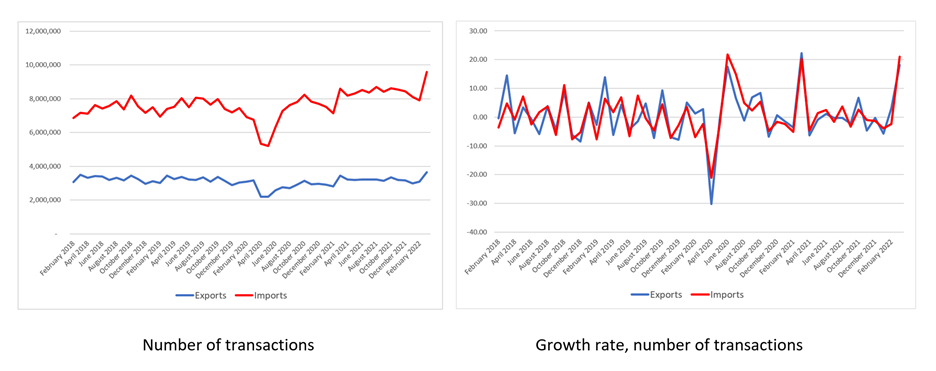
The SBPS has captured sustained supply chain issues for small businesses since its introduction of the measure beginning in August 2020, with about 44.2% reporting domestic supplier delays and about 18.7% reporting foreign supplier delays since August 2021. These numbers equal about 55.3% and 45.4%, respectively, for Wholesale Trade businesses. These data are complementary to the Census Bureau’s international trade data, that include data on the number of import and export transactions, which also indicate supply chain issues. Figure 5 shows both the number of transactions as well as the growth rate in the number of transactions both prior to and after the onset of the pandemic. Both the number of export and import transactions fell dramatically in April 2020 with exports more slowly recovering than imports; the right panel shows there is greater volatility in transactions for both imports and exports since the onset of the pandemic.
Figure 5. U.S. Foreign Trade Transactions, Levels and Growth Rates
(Monthly International Trade Data February 2018-February 2022)
While the SBPS produced timely, important data during the pandemic, the speed with which it was fielded necessitated some collection and methodological choices that led to data products that were not representative of all small businesses, just those that responded. Furthermore, businesses permanently closing as well as survey panel attrition may have added bias to SBPS estimates. The Census Bureau’s new BTOS will include collection and methodological improvements to address representativeness and these sources of bias.
The figures included here only begin to reflect the detail and insights that the SBPS provided during the worst economic conditions small businesses have faced in modern times. Future efforts after the launch and the expansion of the BTOS will include the integration of demographic and high frequency business data to provide new insights into how businesses conditions and outcomes also affect households. The movement from the SBPS to the BTOS this summer represents the ongoing transformation effort to provide more comprehensive and higher frequency near-real time economic data for decision-makers.
For more details, visit the Small Business Pulse Survey website.
[1] More detailed information is available in the SBPS Methodology.
[2] Figures do not include any measures of error and differences are not necessarily statistically significant.


