An Overview of Addressing Nonresponse Bias in the American Community Survey During the COVID-19 Pandemic Using Administrative Data
An Overview of Addressing Nonresponse Bias in the American Community Survey During the COVID-19 Pandemic Using Administrative Data
In 2020, the COVID-19 pandemic disrupted data collection for the Census Bureau’s American Community Survey (ACS) — one of the nation’s most comprehensive sources of population and housing information about the United States. We described the disruptions and how we adapted in the recent blogs Adapting the American Community Survey Amid COVID-19 and Collecting American Community Survey Data From Group Quarters Amid the Pandemic.
In this blog we will discuss an important modification to the American Community Survey (ACS)’s weighting procedures for the 2020 experimental data. Unlike a decennial census, only some households in the United States are asked to participate in the ACS. The Census Bureau creates weights, a widely accepted standard statistical method, for the ACS to make the ACS sample representative of the U.S. population.
While survey weighting has multiple goals, one important goal is correcting for nonresponse bias. Nonresponse bias can occur when the people who complete the survey (respondents) differ from people who do not complete the survey (nonrespondents).
Weighting can mitigate the effects of nonresponse bias. For example, Census Bureau household surveys, like the ACS, adjust their weights to have their age and race statistics match the estimates from the Census Bureau's population estimates. If older individuals are more likely to respond to a survey than younger individuals, for example, then this weighting adjustment will mitigate nonresponse bias with respect to age.
The ACS’s weighting methodology also adjusts to account for differing response rates by census tract and building type (e.g., whether the household lives in a single-family home or an apartment complex).
In 2020, the COVID-19 pandemic brought unprecedented challenges to ACS data collection, as described in the previous blog post Pandemic Impact on 2020 American Community Survey 1-Year Data. These challenges resulted in a lower response rate, which increased nonresponse bias even when the standard weighting corrections were applied.
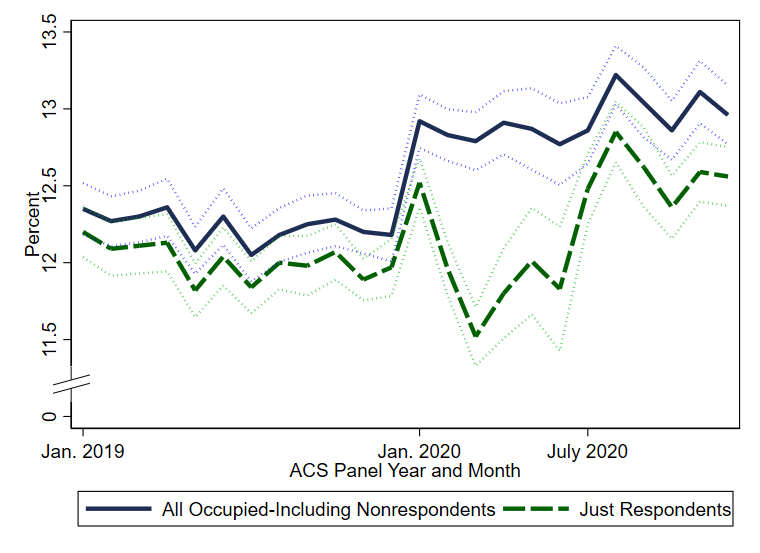
To give a concrete example of what might cause nonresponse bias, Figure 1 shows the share of addresses with W-2 earnings between $1 and $25,000 (in the same calendar year) for ACS respondents (green dashed line). It also shows the share for all occupied housing units in the ACS sample, which includes those households that did not respond (nonrespondents). For the nonrespondents, we are able to match Internal Revenue Service (IRS) and other administrative data to the households, giving us valuable information about their characteristics.
Figure 1: Household W-2 Earnings Between $1 and $25,000
Notes: 90-percent confidence interval shown around each line. For each panel year, the linkages to administrative and third-party data can change. For example, the January through December 2019 data are linked to tax year 2019 W-2 earnings, and the January through December 2020 data are linked to tax year 2020 W-2 earnings. As a result, there can be discontinuous level changes in estimates in January 2020 for all occupied housing units, including nonrespondent and respondent units. For more information on sampling and estimation methods, confidentiality protection, and sampling and nonsampling error, in the ACS, visit 2020 ACS 1-Year Experimental Data Tables.
Source: U.S. Census Bureau, 2019 and 2020 American Community Survey 1-year data matched to Internal Revenue Service data and other administrative data as described in Section 3.2 of Addressing Nonresponse Bias in the American Community Survey During the Pandemic Using Administrative Data.
Before the pandemic, the difference between respondents and all occupied housing units (including those who didn’t respond) was small, suggesting that there wasn’t much difference between respondents and nonrespondents in the proportion who make under $25,000 per year. From a statistical perspective, that means that there was minimal nonresponse bias for this statistic. However, from February 2020 to June 2020, respondents were less likely to have $1 to $25,000 in earnings than those who did not respond, as demonstrated by the difference between respondents and all occupied housing units. Specifically, the figure indicates that low-earning households were much less likely to respond to the ACS in 2020, compared to 2019. This likely biased ACS estimates of income up and poverty down because respondents had higher incomes than nonrespondents. The standard weighting procedure does not use administrative income data as an input, so it is unlikely to correct for the unique response pattern we saw in 2020.
To address this problem, the Census Bureau incorporated innovations to ACS weighting procedures using administrative data for the 2020 experimental release. Through the Census Bureau’s agreements with other federal agencies and third-party vendors, we receive a variety of data on the U.S. population. They include income data from the IRS (such as the W-2 information shown in Figure 1) and demographic and program participation data from the Social Security Administration. These data can be used to better correct for nonresponse bias by using more information about how ACS respondents compare to nonrespondents.
To incorporate these data into the weighting procedures, we use a weighting technique called entropy balancing, which is suited to handling numerous inputs into the weighting model. This method is an application of research that has a long history of use in addressing nonresponse bias in surveys, and has been used successfully to address pandemic-related nonresponse in the Annual Social and Economic Supplement (ASEC) of the Current Population Survey (CPS). Based on the successful use for the CPS ASEC, we created new, experimental weights using entropy balancing and the aforementioned administrative data specifically for the ACS 1-year.
Given the evidence of nonresponse bias in earnings in Figure 1, we calculated alternative estimates of income and poverty using these experimental weights.
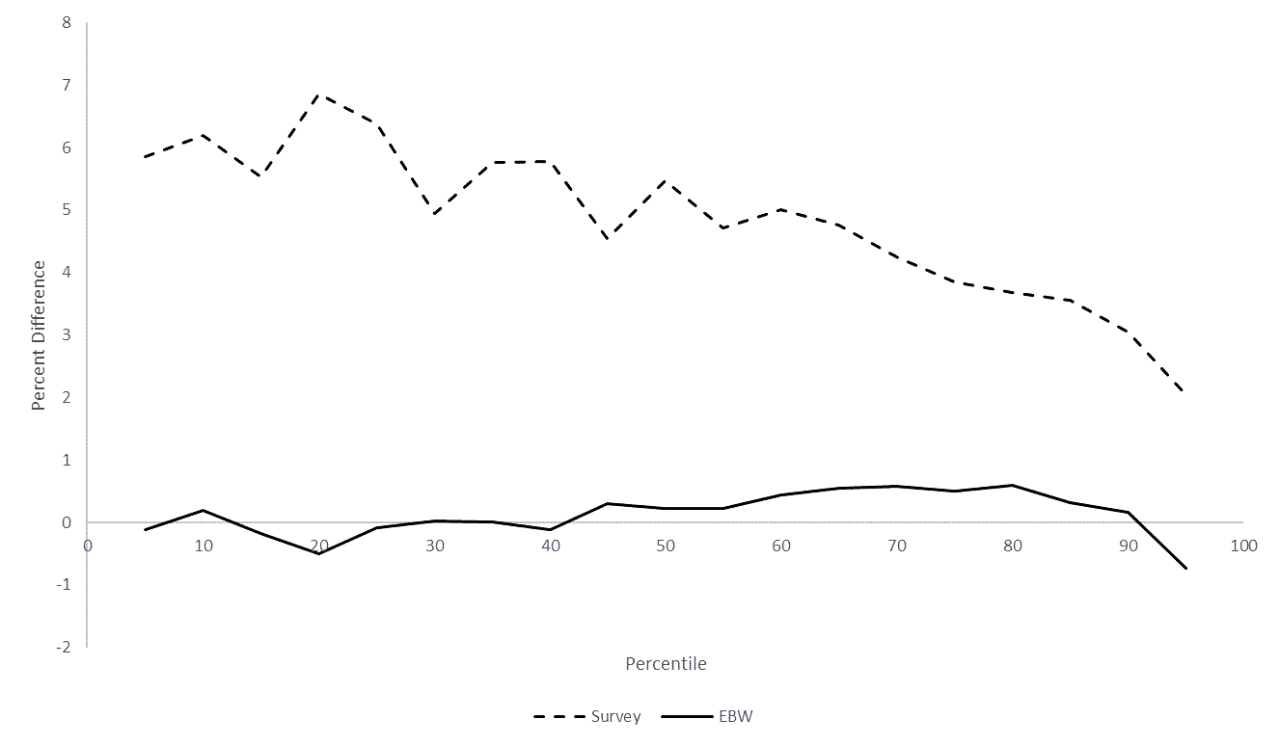
Figure 2 shows estimates of the year-to-year change in real household income at various percentiles of the income distribution.
- The dashed line shows the increase between 2019 and 2020 using the regular survey weights.
- The solid line shows the change using experimental weights.
Figure 2: 2019-to-2020 Increase in Real Household Income – Survey vs. Experimental
Notes: This figure shows estimates of the change in real household income (adjusted by the CPI-U-RS) using the survey and experimental entropy balance weights at each 5th percentile from the 5th to 95th. All estimates are linear interpolations across bins of $2,500.
Source: U.S. Census Bureau, 2019 and 2020 American Community Survey 1-year data. For more information on sampling and estimation methods, confidentiality protection, and sampling and nonsampling error, in the ACS, visit 2020 ACS 1-Year Experimental Data Tables.
The estimated change in income was considerably smaller with the experimental weights. For example, at the median (50th percentile) the regular survey weights estimated an increase in median household income of 5.5 percent. With the experimental weights, the estimated increase is 0.2 percent at the median. The results are similar across the income distribution. Estimated changes in median household income using the experimental weights are close to zero and are substantially lower at every percentile of the income distribution than estimates with the regularly produced survey weights.
Likewise, with the survey weights, the poverty rate declined by nearly a full percentage point from 2019 to 2020. However, using the experimental weights, the estimate of the poverty rate declined by only 0.2 percentage points.
Other characteristics were also potentially affected by nonresponse bias. For example, the distribution of the educational attainment of adults typically changes slowly. The ACS-estimated proportion of adults aged 25 years and over without a high-school degree changed by no more than a half-percentage point annually from 2016 through 2019, but the estimate sharply dropped by more than a whole point between 2019 and 2020 with the regular survey weights.
The new entropy balance weights shifted estimates of the 2020 education distribution downward: those with a bachelor’s degree or higher were down-weighted, while those without a bachelor’s degree were up-weighted. The effects of the experimental reweighting on the 2019 and 2020 estimates combined to reduce the year-over-year change in these measures, bringing them more in line with the stable historical trend as well as benchmarks from external sources like the National Student Clearinghouse.
A separate report, An Assessment of the COVID-19 Pandemic’s Impact on the 2020 ACS 1-Year Data further discusses evidence of nonresponse bias in estimates of other characteristics, such as marital status, Medicaid coverage and citizenship. We examine the effect of the experimental weights on these and other estimates in our working paper, Addressing Nonresponse Bias in the American Community Survey During the Pandemic Using Administrative Data. That paper also provides additional evidence of nonresponse bias, more information on the administrative data used in creating the experimental weights and additional details on the experimental weighting procedure.
In summary, the experimental weights have been successful in adjusting for some of the nonresponse bias. However, they are not enough to overcome all of the challenges. Our working paper offers an extensive discussion of the potential disadvantages of using the experimental weights for statistics that are not highly correlated with the administrative records we used to reweight respondents. We urge caution in using these estimates as a replacement for standard 2020 ACS 1-year estimates. Users should evaluate the estimates and alternatives to determine if they are suited for their needs.


