
Official websites use .gov
A .gov website belongs to an official government organization in the United States.
Secure .gov websites use HTTPS
A lock (
) or https:// means you’ve safely connected to the .gov website. Share sensitive information only on official, secure websites.

Topics
Data & Maps
Surveys & Programs
Resource Library
Tracking Economic Changes Using Census Bureau Data
Tracking Economic Changes Using Census Bureau Data
As we pass the anniversary of the pandemic, the Census Bureau’s economic programs as well as its new experimental business data can inform how the American economic recovery is proceeding, how the recovery differs across and within sectors, and what changes in the composition of economic activity may persist. The value of timely, reliable and high-quality data for policymakers, businesses and the public during a time of national emergency such as the last year should not be understated. The Census Bureau’s economic programs serve a national need, providing data to all while utilizing scientifically valid and transparent methodology. This blog features some of these important programs in describing the dynamics of three important sectors of the economy: services, manufacturing and retail trade, as well as highlighting international trade. The blog closes with some thoughts about what these dynamics might tell us about the recovery.
A large share of the U.S. economy is service based. In 2020, over 45% of GDP was produced in this sector.[1] The Quarterly Services Survey (QSS) provides data on select service sectors and industries including some that were particularly hard-hit during the pandemic (including educational, arts and recreation, and accommodation services) and those that were relatively less impacted (including utilities, information, finance and insurance, and scientific and professional services). The second quarter of 2020 experienced a large drop in seasonally adjusted revenue of 10% measured year over year, reflecting the onset of the pandemic and the months during which shutdown orders and safer at home policies were most widespread. By the end of 2020, revenue for these service sectors had recovered, with less than a percentage point difference for seasonally adjusted year-over-year revenues in the fourth quarter. However, the recovery in these service sectors has not been even, with particularly hard-hit arts and recreation still logging nearly a 33% decrease in year-over-year revenues, and accommodation year-over-year revenue decline estimated at over 42% (Figure 1).
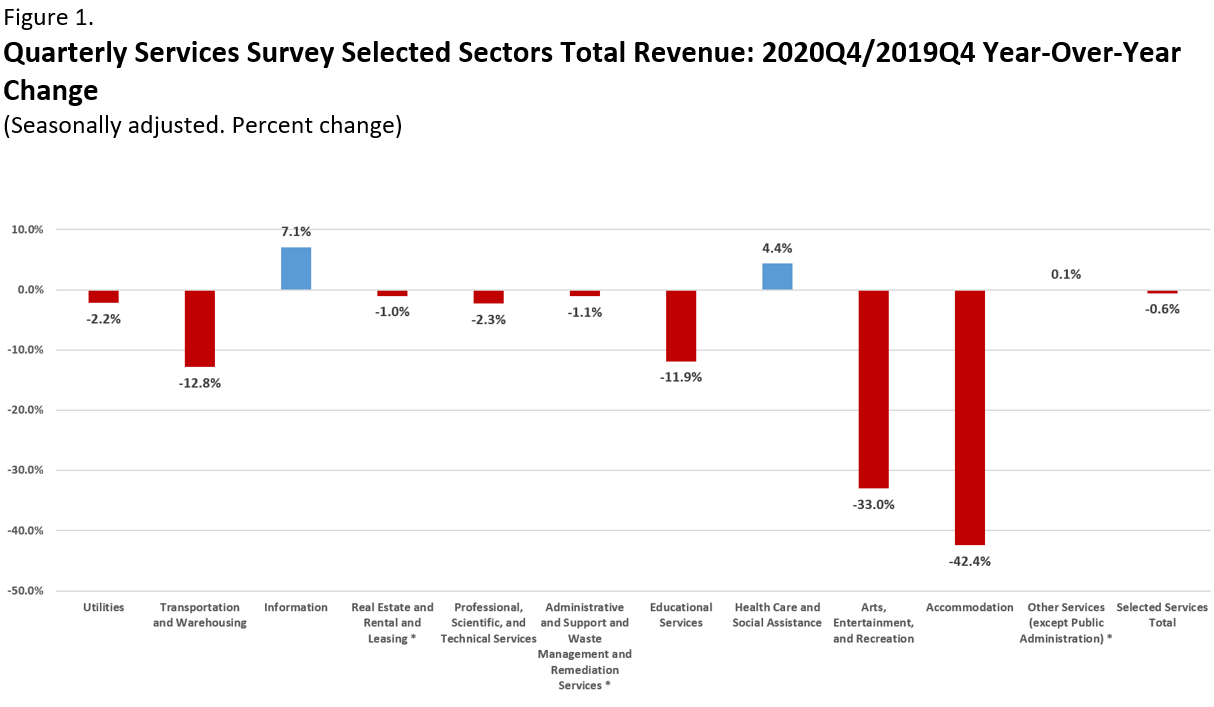
Source: U.S. Census Bureau, Quarterly Services Report. All percent change estimates given are based on the 4th Quarter 2020.
* Estimate not statistically different from zero at the 90% confidence level.
Note: Data adjusted for seasonal variation but not for price changes. Differences between percent changes may be attributed to sampling or nonsampling error, rather than underlying economic conditions. Caution should be used in drawing conclusions from the estimates and comparisons shown. Additional information on the survey methodology, including sampling error (e.g., standard errors and relative standard errors) and nonsampling error, is available at <www.census.gov/services/qss/how_the_data_are_collected.html>.
At the onset of the pandemic, the U.S. domestic manufacturing sector experienced rapid and severe but short-lived declining production, as measured by the Manufacturers’ Shipments, Inventories, and Orders (M3) survey. The seasonally adjusted value of shipments of goods from manufacturers dropped 19% and 17% for April and May 2020 year-over-year measures, respectively, but by July these year-over-year changes had risen to 5% of the year-ago level (Figure 2). New orders, which reflect future manufacturing activity, dropped by large measures in April and May (23% and 16%, respectively), but recovered more quickly than shipments. New orders had recovered to pre-pandemic levels by November and shipments by December.
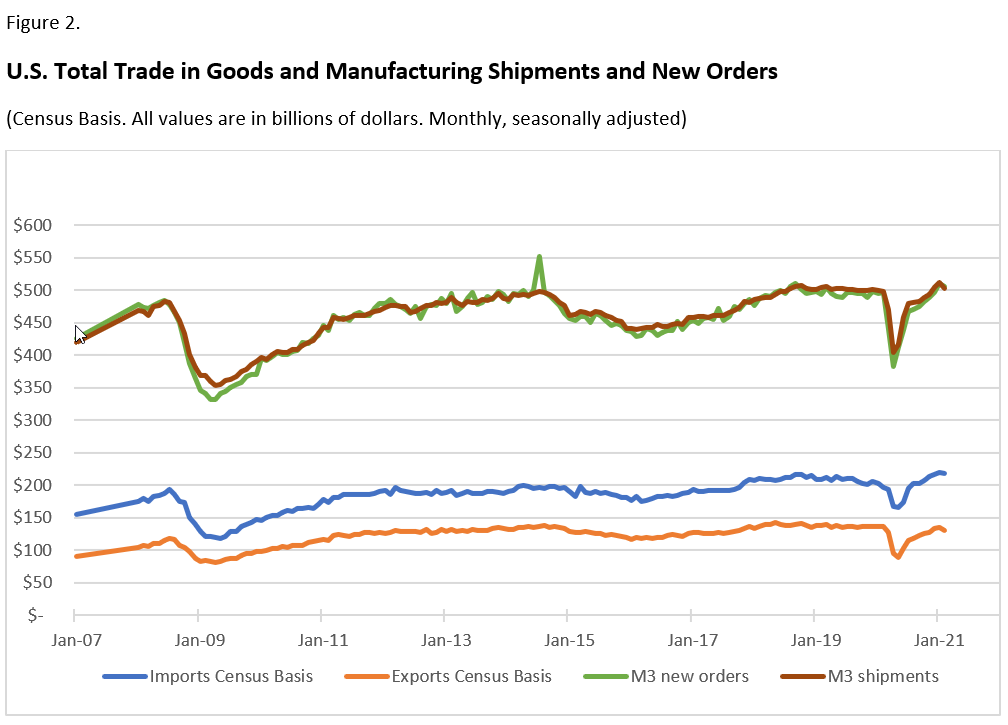
Source: U.S. Census Bureau, Manufacturers’ Shipments, Inventories and Orders Survey and U.S. International Trade in Goods and Services.
Monthly retail and food services sales have been strong since the initial drop at the onset of the pandemic, posting positive growth by June 2020 and reaching record highs by the close of the year (Figure 3). Stay-at-home orders, “safer at home” preferences, the increased investment in online ordering and curbside pickup and/or delivery capabilities by retailers, and various federal programs to support consumers and businesses[1] all contributed to second quarter 2020 growth in online sales (Figure 4). The new experimental weekly Business Formation Statistics show a surge in applications during 2020, with applications for online (nonstore) retailers representing a visually striking majority of those. Recent Census Bureau research notes that this surge in online retailers may in part reflect a desire during the pandemic to move away from retail transactions that require face-to-face interactions, but also the more general trend of growth in e-commerce.[2]
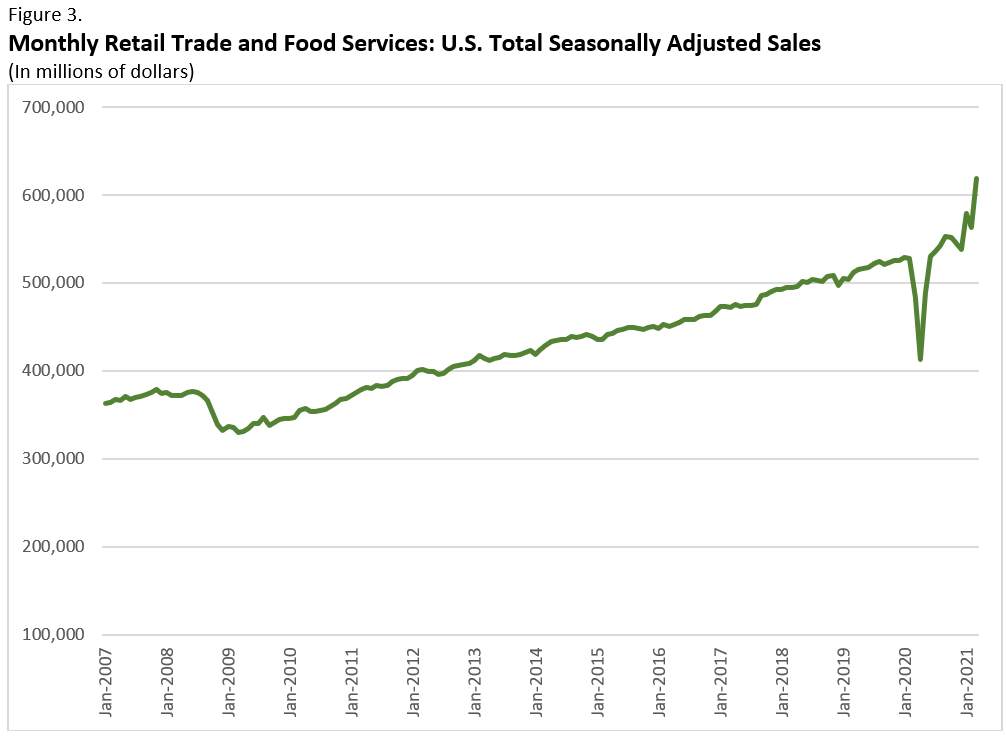
Note: Latest data point for March 2021 is from the Advance Monthly Retail Trade Report released April 2021.
Source: U.S. Census Bureau, Monthly Retail Trade Survey.
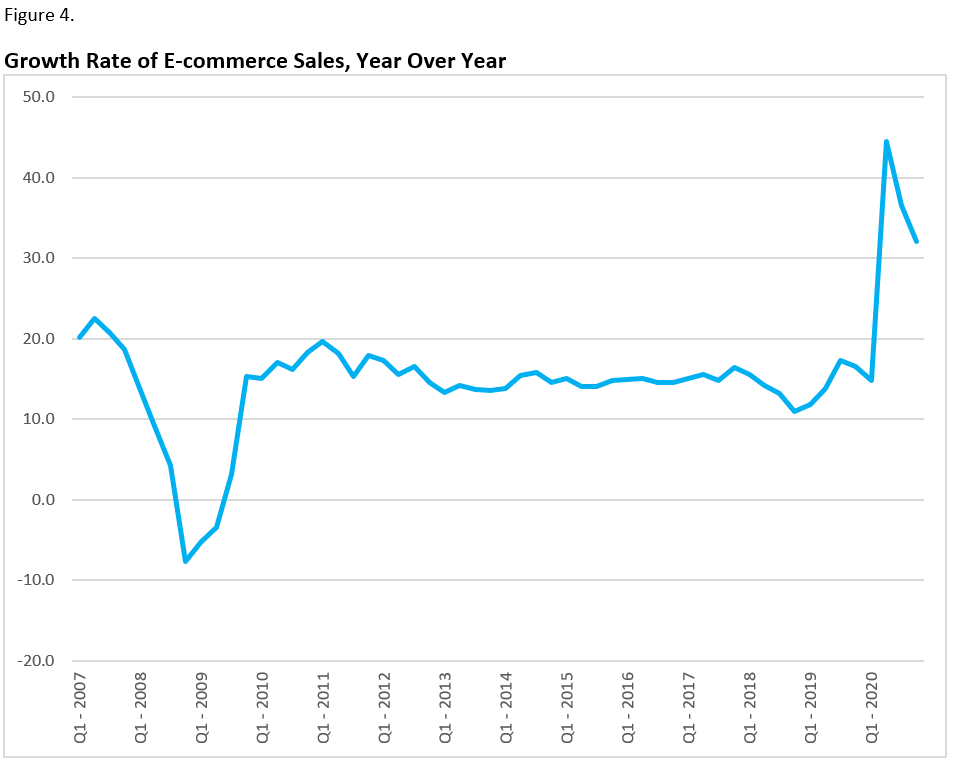
Source: U.S. Census Bureau, Quarterly E-Commerce Report.
The Census Bureau’s International Trade program reflects not an individual sector but rather economy-wide importing and exporting activity of goods. By the close of 2020, U.S. imports had recovered while exports lagged in levels (Figure 2); relatedly, import growth recovered to its pre-pandemic rate, with an increase in year-over-year growth of 5.0%. Monthly export growth, however, remained below the pre-pandemic rate with a negative growth rate of -2.7%. While imports have recovered across most of the broad end-use categories in Figure 5, exports have generally failed to recover, most notably for Capital Goods and Other Goods, and for Automobiles and Consumer Goods to a lesser extent.

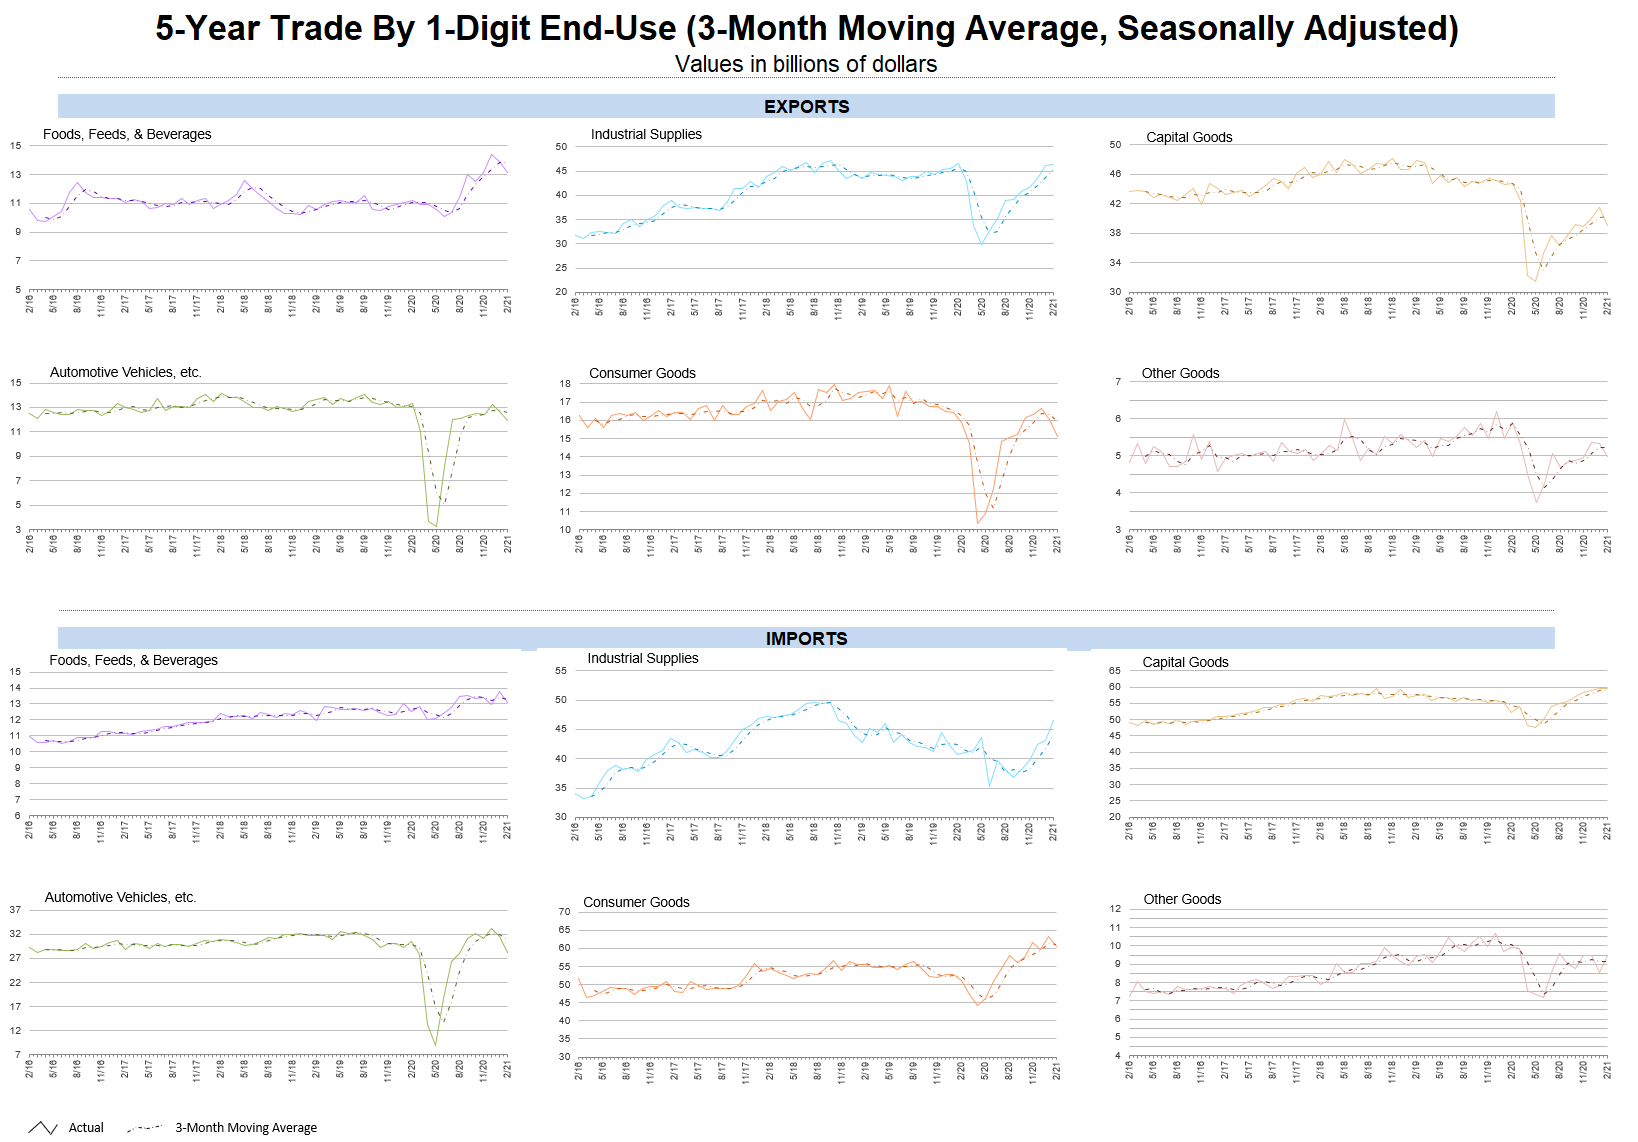
Note: The three-month moving averages shown in these graphs are computed by summing the subject month and the two prior months, dividing by three, and showing the average at the end month of the period. Information on data sources and methodology is available in the information section on page A-1 of the FT-900 release, or at <www.census.gov/ft900>.
Source: U.S. Census Bureau, Trade in Goods by Principal End-Use Category.
While many of the Census Bureau economic indicator programs suggest that the economic recovery is underway, the Census Bureau’s Small Business Pulse Survey (SBPS) provides indications that there are important differences for small businesses. Census Bureau research demonstrates that while conditions have improved for the small employer businesses targeted by the SBPS over the course of the pandemic, even as late as January there is evidence of negative growth in terms of employment and revenues as well as negative business sentiment and expectations, even in the sectors highlighted here that have recovered.[1] The most recent phase of the SBPS covering February through April 2021 shows indications of improving business conditions for many small businesses across multiple dimensions including revenues and employment.
The Census Bureau’s data products and business data research are critical in tracking and understanding the effect of the pandemic on the nation’s economy and people. High frequency business data tracks the economy’s trajectory and detailed data describe the dynamics between and within sectors. The highly detailed Economic Census, occurring every five years, provides context and the gold standard benchmark for these changes over the business cycle. New products such as the weekly Business Formation Statistics and the SBPS demonstrate the Census Bureau’s agility in providing innovative and timely products during an economic emergency and provide evidence of possible compositional changes taking place that may have long-lasting effects on the U.S. economy.
The Census Bureau has reviewed this blog for unauthorized disclosure of confidential information and has approved the disclosure avoidance practices applied. (Approval ID: CBDRB-FY21-ESMD0001-013). The views expressed in this blog are those of the author and not necessarily those of the Census Bureau.
1 See “Table 3. Gross Domestic Product: Level and Change from Preceding Period,” Bureau of Economic Analysis, <www.bea.gov/sites/default/files/2021-01/gdp4q20_adv.xlsx>.
2 See related data from the Bureau of Economic Analysis on federal recovery programs at <www.bea.gov/recovery>.
3 Buffington, Catherine, Daniel Chapman, Emin Dinlersoz, Lucia Foster and John Haltiwanger, 2021, “High Frequency Business Dynamics in the United States During the COVID-19 Pandemic," CES working paper 21-06, Center for Economic Studies, U.S. Census Bureau.
4 Ibid.
This article was filed under:
Page Last Revised - August 24, 2023
✕
Is this page helpful?
 Yes
Yes
 No
No
 Yes
Yes
 No
No✕
NO THANKS
255 characters maximum
 255 characters maximum reached
✕
Thank you for your feedback.
Comments or suggestions?

Comments or suggestions?