Understanding the Relationship Between Individual Earnings and Household Income
Understanding the Relationship Between Individual Earnings and Household Income
One question we often receive after our annual release of the income and earnings estimates from the Current Population Survey Annual Social and Economic Supplement is the extent to which the changes in the estimates of individual earnings and in household income are related.
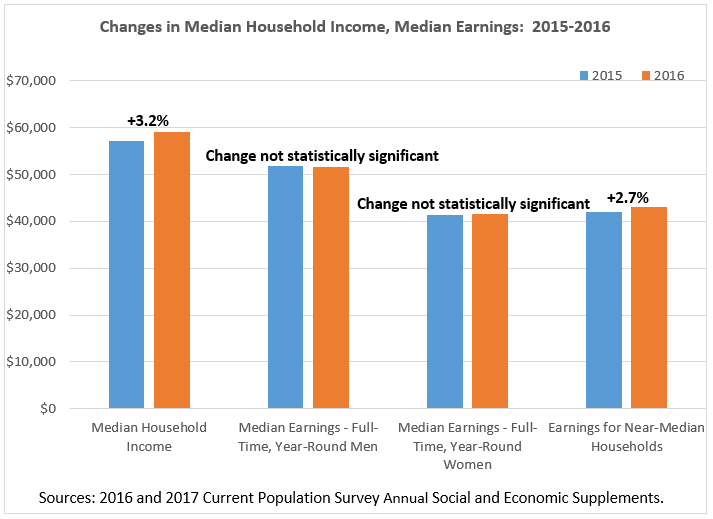
For example, in 2016, real income for a “typical”, or median, household increased by a statistically significant 3.2 percent from 2015, but real earnings for “typical”, or median, full-time, year-round male and female workers in 2016 were not statistically different from 2015. These results appear inconsistent with each other: how could income for the “typical” household increase if earnings for the “typical” full-time worker did not?
There are two factors at play here. First, earnings includes only wages, salaries, and income from self-employment for individual workers. Household income, however, includes not just earnings for each household member but also income from social security, interest, dividends, and many other sources. Second, it also turns out that the “typical” worker is not necessarily a member of a “typical” household. In fact, the “typical” full-time, year-round worker is a member of a higher income household. Let us walk you through how this could be true.
To demonstrate this, we look at households with incomes very close to the median (between the 48th and 52nd percentiles, for this example). These near-median households have incomes that are very similar to the median household; the average income of these near-median households was $59,074 in 2016, which is not statistically different from the 2016 median household income of $59,039. By examining a group of households that are near the median, we avoid focusing on just one particular median household whose characteristics may not be representative.
We can then examine these near-median, households to see what their members earn. The full-time, year-round workers in these households earn on average $41,410 for men and $37,543 for women. Each of these is significantly lower than the corresponding overall median earnings for men and women working full time, year-round: $51,640 and $41,554, respectively.
Put differently, workers in “typical” households earn less than the “typical” full-time, year-round worker. Further, not all near-median households have workers that work full time and year-round. Some may have part-time or part-year workers, or no workers at all. In fact, these near-median households have 1.3 workers on average, with about 0.8 of those workers working full time, year-round.
Let’s return to the concrete example of 2016. Recall that even though median earnings for full-time, year-round men and women were not statistically different between 2015 and 2016, median (and near-median) household income increased by 3.2 percent. This seeming contradiction is resolved when we look at earnings in these near-median, “typical” households (including earnings from part-time or part-year workers), which increased 2.7 percent in 2016.
Therefore, “typical” households have workers who may work full-time, year-round and others who work less. These workers earn less than the “typical” full-time, year-round worker; however, their earnings grew from 2015 to 2016 while the earnings of the “typical” full-time, year-round workers did not. These increased earnings were responsible for most of the increase in “typical” household income (with the rest from other income sources, such as Social Security, interest, dividends, etc.).
To conclude, the statistics for median household income and full-time, full-year workers can often change in different directions. This is because 1. household income includes income sources besides earnings, and 2. earnings in median (and near-median) households generally come from workers who are different from the median full-time, full-year worker.


