
Official websites use .gov
A .gov website belongs to an official government organization in the United States.
Secure .gov websites use HTTPS
A lock (
) or https:// means you’ve safely connected to the .gov website. Share sensitive information only on official, secure websites.

Topics
Data & Maps
Surveys & Programs
Resource Library
City and Town or "Subcounty" Estimation Methodology
City and Town or "Subcounty" Estimation Methodology
The U.S. Census Bureau produces estimates of the total resident population for all areas of general-purpose government on an annual basis. These subcounty areas consist of both incorporated places, such as cities, boroughs, and villages; and minor civil divisions such as towns and townships.
The estimates geographic universe and population base data are updated each year to reflect legal changes reported in the Boundary and Annexation Survey, other geographic program revisions, and census corrections. The base population represents our estimates universe and includes all levels of geography we need for estimates production and reporting. The year-to-year differences in the base population tend to be larger and more frequent at the local government level because cities and towns are more likely than larger geographies to annex land or dis-incorporate. The annual time series accounts for these differences as we update the estimates to include these revisions for each year going back to the 2010 Census.
The Administrative Record (ADREC) county household population is allocated to areas within each county based on the household population estimates developed using the Distributive Housing Unit Method. The populations of all areas within a county are controlled to the total population of that county, meaning that any method changes applied at the county level proportionally affect the subcounty areas within it. In this way, changes to a subcounty area’s population are often driven by the county’s population growth or decline, the area’s share of occupied housing units, and the average number of persons per household.
We process all subcounty data at what we call the “primitive” geography level. These are just the smallest pieces of land that make up counties, cities and towns which cannot be further subdivided. They are processed in three major steps:
Step 1: We calculate the uncontrolled household population (see Figure 1). We start with the housing unit estimates for the current year. Next, the 2010 Census values for occupancy rates and the average persons per household (PPH) are applied to the housing unit estimates to create the uncontrolled household population for each area within a county.
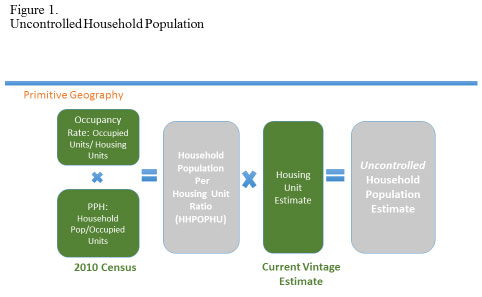
The product of the occupancy rate and the Persons Per Household (PPH) yields to the Household Population Per Housing Unit ratio (HHPOPHU), which reflects the average household population per total housing units as it is shown in Figure 1.
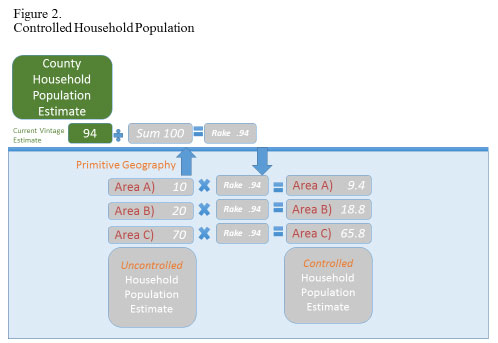
Step 2: Figure 2 illustrates the second step in the city/town estimation process. It demonstrates how the controlling to the ADREC county total is developed. The population estimates for cities and towns are created by distributing the county population estimates to each place within the county, based on the place’s number of occupied housing units and the average persons per household. The uncontrolled household population results are controlled to the county household population estimate by applying the rake factor. The rake factor is essentially a ratio of the County Household Population estimate by the sum of the Uncontrolled Household Population estimates for all areas within that county.
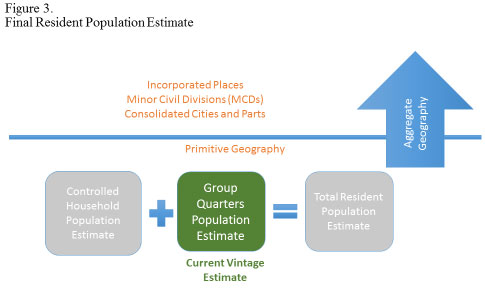
Step 3: Last, the controlled household population estimate is added to the group quarters population estimate (college dorms, prisons, nursing homes, etc.) to produce the final estimate of total subcounty resident population shown in Figure 3 below.
The U.S. Census Bureau’s Population Estimates Program produces and publishes estimates of the resident population for the United States, its states, counties/county equivalents, cities and towns collectively known as “subcounty” areas, as well as for the Commonwealth of Puerto Rico and its municipios. The resident population includes all people currently residing in the United States. These estimates are used to allocate federal and state funds, as well as serving for controls for major surveys, government data collections, and public and private research.
###
Page Last Revised - October 8, 2021
✕
Is this page helpful?
 Yes
Yes
 No
No
 Yes
Yes
 No
No✕
NO THANKS
255 characters maximum
 255 characters maximum reached
✕
Thank you for your feedback.
Comments or suggestions?

Comments or suggestions?