Outlying Older Americans: The Puzzle of Increasing Poverty among those 65 and Older
Outlying Older Americans: The Puzzle of Increasing Poverty among those 65 and Older
Erratum Note:
The U.S. Census Bureau identified an error in the input of Supplemental Poverty Measure thresholds for renters used in the 2016 Supplemental Poverty Measure data products. The base threshold should have been $26,104 and was erroneously entered as $26,014. This error affected the Supplemental Poverty Measure poverty status for 109 unweighted observations. As a result, the overall Supplemental Poverty Measure poverty rate was understated by 0.06 percentage points—13.91 in published tables compared to 13.97 percent. Corrected tables, research files and a revised report are available on our website.
Note: The Supplemental Poverty Measure rate has been corrected. All updated figures are in red. Please disregard the previous version of this blog.
On September 12, the U.S. Census Bureau released estimates from the Current Population Survey Annual Social and Economic Supplement, known as the CPS ASEC, showing that national poverty rates declined by 0.8 percentage points in 2016 — to a rate of 12.7 percent. Poverty rates declined for many different demographic groups, including whites, blacks, Hispanics, males, females, children, the native-born and the foreign-born.
While no demographic group highlighted in this year’s income and poverty report experienced an increase in poverty rates from 2015 to 2016, individuals ages 65 and older had the unique distinction of being the only population segment to experience a significant increase in the number of individuals in poverty, with 367,000 more older Americans in poverty in 2016.
This finding could be explained by the aging of the baby boom generation (those born between 1946 and 1964) which contributed to faster population growth in the population ages 65 and over in 2016 compared with the overall population. Population growth alone would lead to increases in the number of older Americans both in and out of poverty. However, among older Americans living alone (or with nonrelatives), increases in the number of individuals in poverty outpaced their population growth, leading to statistically significant increases in their poverty rate from 16.0 percent in 2015 to 18.1 percent in 2016. Changes in the number and percentage of older adults living in families (with a spouse or relatives) in poverty were not statistically significant. Future research will explore the impact of changing demographics within the 65 years and over population on poverty rates.
Income-to-poverty ratios are useful for gauging the depth of poverty among those with incomes below their poverty thresholds. The population ages 65 and older was the only demographic group covered in the 2016 report for whom the proportion of individuals with income below 50 percent of their poverty threshold increased, growing from 2.8 percent in 2015 to 3.3 percent in 2016.
Similar trends are seen in the 2016 supplemental poverty measure report, also released on September 12. The supplemental poverty measure, uses alternate income definitions and poverty thresholds to provide a more detailed understanding of economic well-being. Unlike the official poverty measure, the supplemental poverty measure accounts for the value of noncash transfers as well as costs associated with taxes and necessary expenses (such as medical and work-related). The supplemental poverty measure also adjusts poverty thresholds for geographic differences in the cost of living as well as home ownership status. Like the official poverty measure, the supplemental poverty measure found an increase in the number of adults ages 65 and older in poverty — an increase of 662,000 individuals.
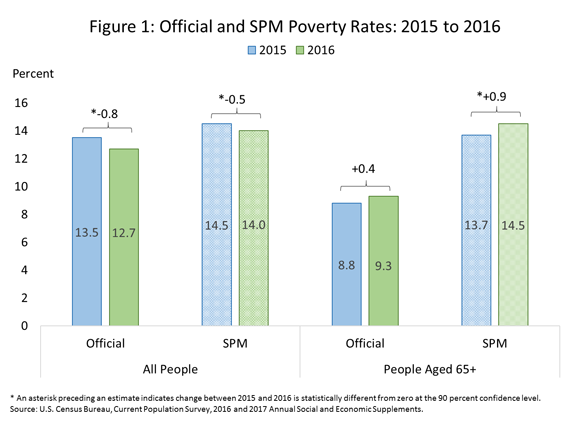
On the other hand, as shown in Figure 1, while the change in the official poverty rate among those ages 65 and older was not statistically significant, the supplemental poverty rate for older adults increased by 0.9 percentage points in 2016. Similar to trends in the official poverty measure, the share of individuals ages 65 and older with resources below half their supplemental poverty measure threshold also increased, from 4.5 percent in 2015 to 5.2 percent in 2016.
Examining both cash and noncash components of the supplemental poverty measure, Social Security was the only component of income which had a significantly smaller impact on poverty rates among adults ages 65 and over from 2015 to 2016. In 2016, Social Security benefits kept 34.8 percent of individuals ages 65 and older out of poverty, while those payments lifted 36.2 percent of this population out of poverty in 2015.
Recent research conducted at the Census Bureau suggests that household surveys may undercount income across sources and demographic groups. Bee and Mitchell (2017), for example, use a variety of administrative records to correct for underreporting of income, calculating a 2012 poverty rate for those ages 65 and older that was 2.2 percentage points lower than the official poverty rate derived from survey data — discrepancies that were largely driven by the underreporting of retirement income among this population. We plan to extend this research to cover the survey data after the 2014 redesign of the CPS ASEC income questionnaire. These findings add to the puzzle of interpreting this years’ outlying poverty trends among those ages 65 and older.
As analysts at the Census Bureau continue to research and report on these and other findings from the release of the CPS ASEC, we invite data users to access additional detailed tables on income and poverty that allow for investigation into economic trends across time periods and populations.


