Median Earnings over the Last 40 Years
Median Earnings over the Last 40 Years
In Figure 2 of the 2016 income and poverty report, we show estimates of median earnings for full-time, year-round workers, from which we calculate the most widely accepted measure of the male-female earnings gap. However, we can dig a little deeper — how do earnings in 2016 for all workers (not just full time, year-round) compare to those over the last 40 years? By looking at all workers, our estimates can account for changes in earnings if someone goes from working full time to part time, from year-round to only part of the year, or into full-time, year-round work.
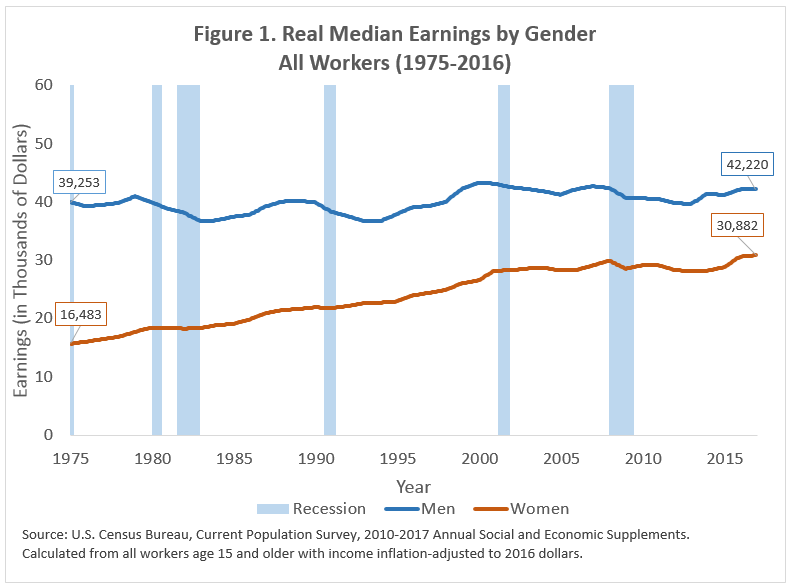
For all female workers, the story is simple (Figure 1 below) — real median earnings in 2016 were higher than in any of the last 40 years. Median female earnings have been rising — from $16,483 in 1976 to $30,882 in 2016, an increase of 87 percent (or 1.6 per year, on average).
For all male workers, the picture is more complicated. During and following each recession, men experienced declines in real median earnings. In the expansions that followed, median earnings rebounded. This decline in earnings occurred during the 2007-2009 recession, as well. However, compared to their peak in 1999 ($43,360), median male earnings in 2016 ($42,220) were 2.6 percent lower. Across the last 40 years, median male earnings were higher in 2016 than any year prior to 1998 and each year from 2008 to 2014. However, compared to 40 years ago, median male earnings have increased only 6.8 percent from $39,523 in 1976 to $42,220 in 2016, which is an average annual increase of 0.17 percent over the period.
If we instead focus our attention on full-time, year-round workers <Figure 2>, the picture is different. For men, we do not see the same decline in median earnings at each recession with a subsequent rebound. This reflects the fact that recessions can affect both earnings and how many hours people work (including whether they work full time and year-round). Additionally, full-time, year-round male workers did not earn statistically significantly more in 2016 than they did in 1976 ($51,624 in 1976 compared to $51,640 in 2016).
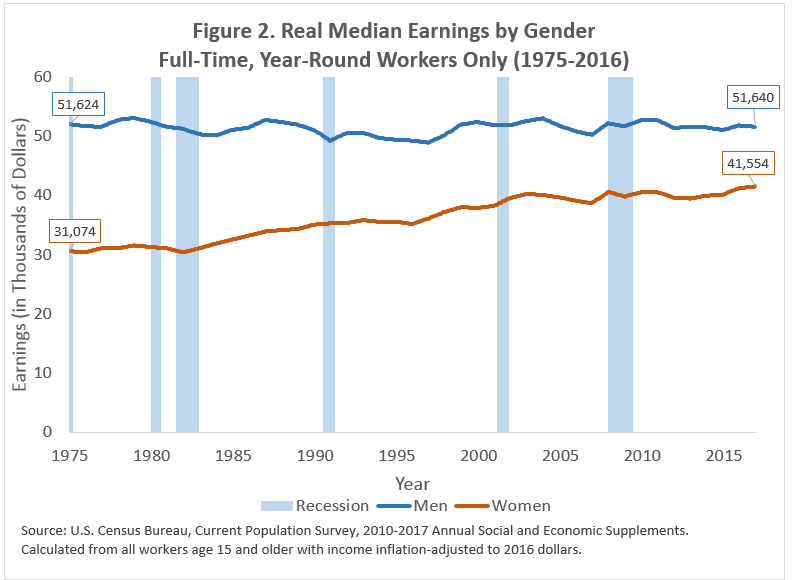
For women, Figures 1 and 2 tell roughly the same story – earnings have increased over time without generally declining during recessions. However, the differences in Figures 1 and 2 for women reflect the changing nature of work for women, as more women moved into full-time and year-round work. For full-time, year-round female workers, real median earnings were 33.7 percent higher in 2016 ($41,554) than 1976 ($31,074), for an average annual increase of 0.73 percent.
This analysis highlights the importance of keeping in mind who is in the group when we evaluate earnings. Over time, there can be changes in the share of the population that works (which is not directly reflected above), how many weeks they work per year, how many hours they work per week, and how much they earn per hour. As these change over time or over the business cycle (recessions and expansions), our estimates of annual earnings will be affected.