Census Bureau Releases 2016 Supplemental Poverty Measure
Census Bureau Releases 2016 Supplemental Poverty Measure
Erratum Note:
The U.S. Census Bureau identified an error in the input of Supplemental Poverty Measure thresholds for renters used in the 2016 Supplemental Poverty Measure data products. The base threshold should have been $26,104 and was erroneously entered as $26,014. This error affected the Supplemental Poverty Measure poverty status for 109 unweighted observations. As a result, the overall Supplemental Poverty Measure poverty rate was understated by 0.06 percentage points—13.91 in published tables compared to 13.97 percent. Corrected tables, research files and a revised report are available on our website.
Note: The Supplemental Poverty Measure rate has been corrected. All updated figures are in red. Please disregard the previous version of this blog.
Today, the U.S. Census Bureau, in collaboration with the Bureau of Labor Statistics, released its seventh annual supplemental poverty measure report. This measure extends the official poverty measure by explicitly including benefits from many of the government public assistance programs designed to assist low-income families and individuals. While the official poverty measure only looks at pretax money income, the supplemental measure adds the value of noncash benefits such as the Supplemental Nutrition Assistance Program, known as SNAP; school lunches; housing assistance and refundable tax credits like the Earned Income Tax Credit into the definition of resources. Additionally, necessary expenses such as taxes, child care and work expenses and contributions toward the cost of medical care and health insurance premiums are deducted from income. The supplemental poverty measure uses thresholds that are produced by the Bureau of Labor Statistics, Division of Price and Index Number Research, that vary by housing tenure status and are adjusted to reflect geographic differences in the cost of housing.
The supplemental poverty measure rate in 2016 was 14.0 percent, which was lower than the rate of 14.5 percent in 2015. The supplemental poverty rate was higher than the official poverty rate of 12.7 percent in 2016.
An important contribution of the supplemental poverty measure is that it allows one to gauge the effectiveness of tax credits and transfers in reducing poverty. It can also show the impact of necessary expenses, such as paying taxes or work-related and medical expenses, on a family’s ability to meet basic needs.
For example, the supplemental poverty measure report shows that:
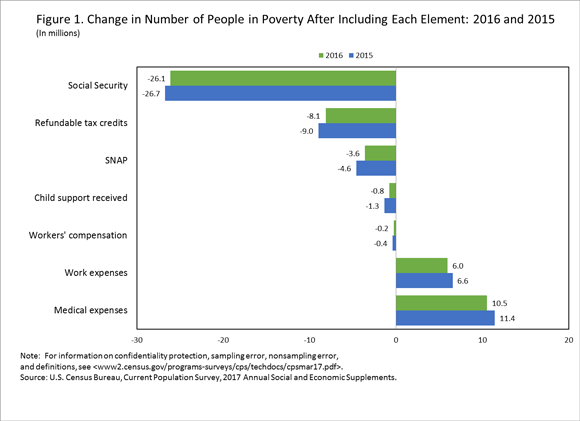
- Social Security continues to be the most important anti-poverty program, moving 26.1 million individuals out of poverty. Refundable tax credits and SNAP moved 8.1 million and 3.6 million people out of poverty in 2016, respectively.
- However, since 2015, the anti-poverty impacts of refundable tax credits and SNAP each declined, lifting 0.8 million fewer and 1.0 million fewer individuals out of poverty, respectively.
- Conversely, medical expenses pushed fewer people into poverty in 2016 than in 2015. In 2016, 10.5 million additional individuals were considered poor with the exclusion of medical costs from supplemental poverty measure resources. This is a decline of 0.9 million people from 2015.
Figure 1 shows the effect of various elements of the supplemental poverty measure on the number of individuals below poverty in 2015 and 2016. The green bars show the total impact in 2016 while the blue bars represent 2015. A more comprehensive list of components can be found in Appendix Table A-7.
For more information, check out The Supplemental Poverty Measure: 2016 report.


