The Role of Firm Age in the Dynamics of Job Creation and Destruction
The Role of Firm Age in the Dynamics of Job Creation and Destruction
The annual net job creation in the United States — or the change in total employment — totaled 3.1 million in 2015, according to an analysis of data from the U.S. Census Bureau’s Business Dynamic Statistics, or BDS, program. Net job creation is equal to job creation minus job destruction across establishments in the United States. The 2015 BDS provide annual statistics on job creation and destruction, establishment births and deaths, and firm startups and shutdowns. These statistics are available by firm age, firm size, industrial sector and state. The data tables are available by both firm and establishment characteristics.
In 2015, net job creation totaled 3.1 million — which is equal to the job creation total of 16.8 million minus the job destruction total of 13.7 million. As measured in the BDS program, jobs are created either by the opening of new establishments or by year-to-year increases in employment at existing establishments. Existing jobs are eliminated either by the closing of existing establishments or by year-to-year decreases in employment at existing establishments.
Job Creation (16.8 million) – Job Destruction (13.7 million) =
Net Job Creation (3.1 million)
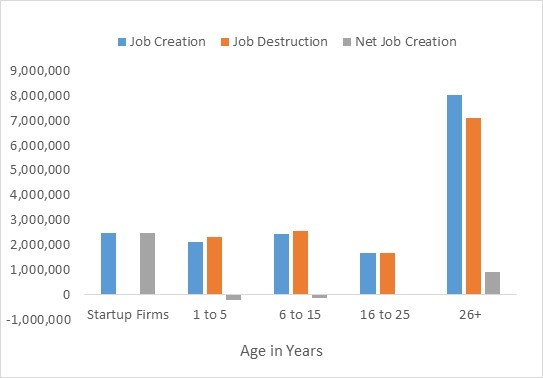
Firm age closely relates to job creation and destruction, and understanding the role of firm age in the dynamics of job creation, job destruction and net job creation in the United States is important for policymakers and economists. Today’s BDS release breaks these data down by five firm age groups, as shown in Figure 1. Data tables in the release show even greater detail by firm age. As Figure 1 highlights, the 26-plus age class had, by far, the highest levels of job creation and job destruction in 2015, with job creation equaling about 8.0 million and job destruction about 7.1 million.
Figure 1. Job Creation, Job Destruction and Net Job Creation by Firm Age: 2015
Source: U.S. Census Bureau, 2015 Business Dynamics Statistics.
The difference equals the net job creation of about 935,000 jobs. These high levels of job creation and destruction for the 26-plus age class are not surprising given most employment in the economy overall is concentrated in this age group. In fact, in 2015, the 26-plus age class accounted for about 62.0 percent of total U.S. employment. The net job creation of about 935,000 was also higher than any other age class, with the exception of startup firms.
Continuing with Figure 1, for startup firms, job creation equaled about 2.5 million in 2015. By definition, job destruction for startups is always zero so that net job creation is always equal to job creation for this group. Net job creation for startups was 2.5 million; the highest level for any age class (which again, reflects the fact they are the only age group where job destruction, by definition, always equals zero).
Finally, Figure 1 also shows the 16 to 25 firm age class had the lowest job creation and destruction levels of any other group, with job creation totaling about 1.69 million, job destruction about 1.66 million, and net job creation about 24,000. The 1 to 5 and 6 to 15 age classes had similar patterns of job creation and destruction. For the 1 to 5 age group, job creation equaled about 2.11 million, job destruction about 2.32 million, and net job creation about -212,000. For the 6 to 15 age group, job creation equaled 2.44 million, job destruction about 2.56 million, and net job creation about -120,000. These two groups were the only classes with a negative impact on net job creation in 2015.
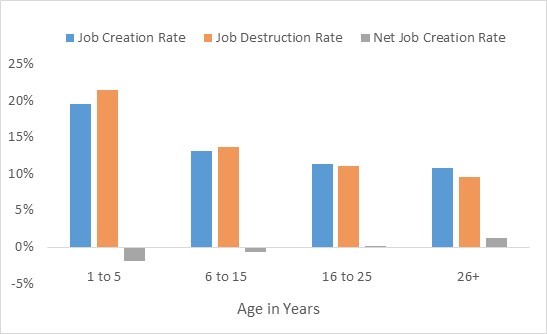
In addition to examining levels, it is also instructive to compare job creation, job destruction, and net job creation rates by firm age class. Rates demonstrate how the different age groups are changing relative to their employment size. In Figure 2, rate data are displayed by firm age class. Startup firms are excluded here because, by definition, they did not exist in the prior year and therefore had zero employment, which makes it impossible to calculate a standard rate of change. Figure 2 shows the 1 to 5 age class had the highest rates of both job creation and destruction, with rates for both at around 20.0 percent. This means this class showed the most change, or volatility, relative to their size. This is consistent with research that documents an “up-or-out” pattern among young firms, by which many fail but among those that succeed, a select few grow rapidly and contribute disproportionately to overall employment growth.
In general, job creation and job destruction rates decline with firm age. For example, in contrast to the 1 to 5 age class, the rates for the 26-plus age class were much lower, with the rates for job creation and destruction both close to 10.0 percent. While these rates are only about half of the rates for the 1 to 5 age class, they still represent considerable volatility for a group of mature firms. For the 16 to 25 age group, rates were slightly higher than for the 26-plus age class, with a rate of about 11.0 percent for both job creation and job destruction. For the 5 to 15 age class, rates were a little higher still than for the 16 to 25 age group, with rates for both job creation and destruction equaling about 13.0 percent.
Figure 2. Job Creation, Job Destruction and Net Job Creation Rates by Firm Age: 2015
Source: U.S. Census Bureau, 2015 Business Dynamics Statistics.
Data are obtained from Census Bureau reports and administrative records from other federal agencies. Quality assurance procedures are applied to all phases of collection, processing and tabulation to minimize errors.


