50 Years of Poverty Statistics
50 Years of Poverty Statistics
This year’s release of the official poverty rate will mark the 50th anniversary of the first national poverty statistics published by the U.S. Census Bureau. The first national poverty estimates were released on August 21, 1967. That initial report included a single paragraph describing the number of people below the poverty level and the incidence of poverty, paired with a single table of poverty estimates.
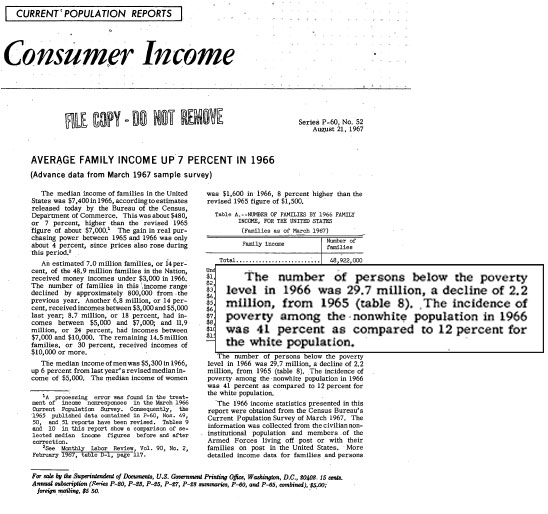
Like this year’s report, the 1967 estimates were based on data from the Current Population Survey Annual Social and Economic Supplement, known as CPS ASEC, the nation’s oldest ongoing household survey. The 1967 table was the first time the Census Bureau published poverty estimates using the thresholds developed by Mollie Orshansky of the Social Security Administration. This year’s report will use these same thresholds, though the dollar amounts are updated to reflect changes in consumer prices.
In 1967, the report included a single table with poverty estimates for 1959, 1961, 1963, 1965 and 1966. This year’s report will include more than 1,000 tables with estimates for each year from 1959 to 2016. Users will be able to create their own tables using the Census Bureau’s Current Population Survey Table Creator, download micro data to conduct their own analysis, and use the Census Bureau’s application programming interface to create their own applications.
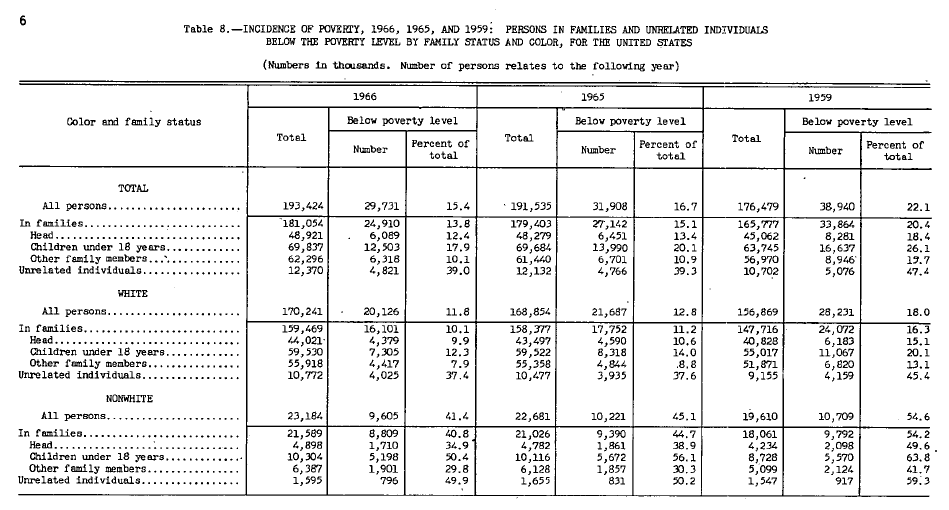
The 1967 table examined the incidence of poverty by family status and “color.” Poverty estimates were provided for whites and nonwhites. In contrast, the estimates released for 2016 will examine poverty by dozens of dimensions. Poverty rates will be published for whites, blacks, Asians and Hispanics but also by age, family type, region, place of residence, educational attainment, work experience and disability status, to name a few.

In 1967, data users could order a copy of the report by sending in $.15 to the Government Printing Office ($5 would buy a subscription to a number of Census Bureau reports for the year). Today users can download a PDF of the report and figures, or excel versions of many of the tables. Last year, users downloaded the Income and Poverty in the United States: 2015 report 7,000 times from census.gov.
In 1967, the poverty estimates were not yet designated as the official poverty estimates. They would not receive that designation until May 1978 with the Office of Management and Budget’s Statistical Policy Directive 14.
Fifty years ago, the poverty thresholds for nonfarm families ranged from $1,560 for a female unrelated individual age 65 or older to an average of $5,440 for a family of seven or more. This year’s poverty thresholds range from $11,511 for single individuals age 65 and older to $46,400 for a family of eight or more. Unlike the original Orshansky thresholds, the current thresholds are the same for farm and nonfarm families and do not differ by the sex of the householder. For a history of the poverty thresholds, see “The Development of the Orshansky Thresholds.”
Prior to the 1967 report, the Census Bureau published a report in 1965 on the “Low-Income Families and Unrelated Individuals in the United States: 1963” but that report did not use the term poverty and did not use the Orshansky thresholds. The earlier report used low-income thresholds of $3,000 for families, regardless of size, and $1,500 for individuals.
For a history of poverty measurement in the United States, follow this link to an infographic we released on the 50th anniversary of President Lyndon Johnson’s declaration of a “War on Poverty.”
For more information on the data released this year, watch the live broadcast on the Census Bureau’s YouTube channel. News media and other data users can dial into the virtual press conference.
###