An official website of the United States government
Here’s how you know
Official websites use .gov
A .gov website belongs to an official government organization in the United States.
Secure .gov websites use HTTPS
A lock (
) or https:// means you’ve safely connected to the .gov website. Share sensitive information only on official, secure websites.
-
//
- Census.gov /
- Newsroom /
- Census Blogs /
- Random Samplings /
- United States Mover Rate at a New Record Low
United States Mover Rate at a New Record Low
United States Mover Rate at a New Record Low
According to results from the 2016 Current Population Survey Annual Social and Economic Supplement (CPS ASEC), 11.2 percent of the U.S. population age 1 and over moved between 2015 and 2016. This is the lowest one-year mover rate reported by the CPS ASEC, which began tracking migration in 1948. At that time, moving was more commonplace, as demonstrated by an annual mover rate of 20.2 percent.
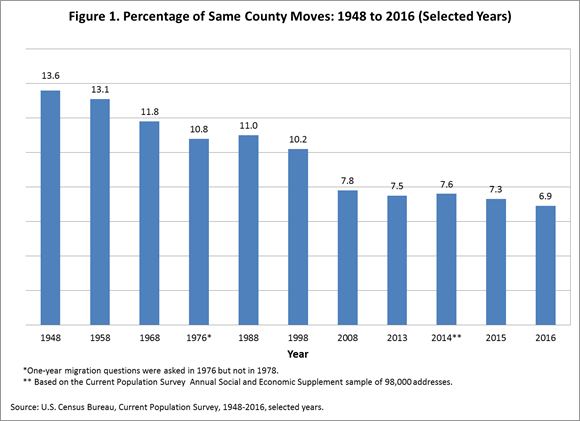
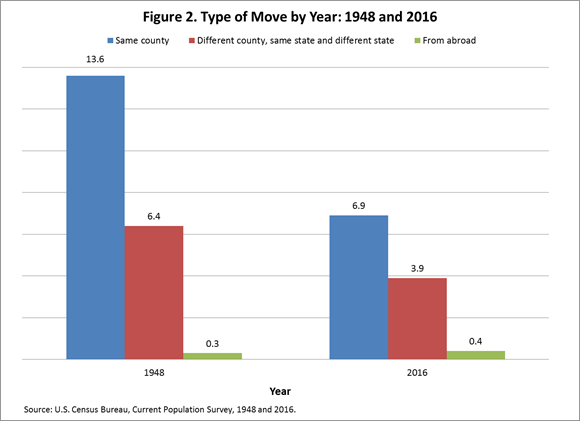
The historical CPS migration tables and figures help unpack the contributors to the declining moving rate. In this blog, the data track three different types of moves: within the same county, between different counties (in the same state and to different states), and from abroad. Moves within the same county and between counties are well below the 1948 levels as seen in Figure 2. The most frequent moves in 1948 and 2016 were within the same county (Figure 1), but the likelihood that a household will make such a move fell over that 68-year period. The decline in within-county moves has been steady. Between 2015 and 2016, this series registered an additional 0.4-point drop, culminating with the record low of 6.9 percent in 2016.
Movement to a different county, whether in the same or different state, decreased over time as well, but not to the same extent as movement within the same county. The 1948 estimate shows 6.4 percent moved to a different county or state. Fast forward to 2016 and this number has dropped to just 3.9 percent.
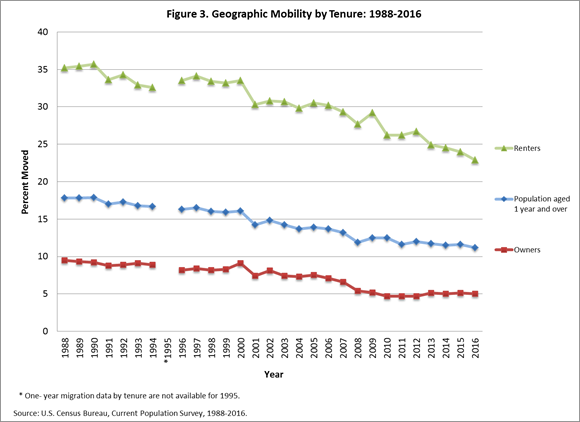
With the historical tables, it is possible to examine differences in mover rates by selected characteristics. One common characteristic often associated with migration is housing tenure. In Figure 3, housing tenure is separated into two categories: (1) people who live in owner-occupied housing units (owners) and (2) people who live in renter-occupied housing units (renters). Since 1988, the first year tenure data appeared in the CPS migration tables, renters have always had higher rates of mobility compared with owners. Often, mover rates for renters are two to three times higher. For example, between 2015 and 2016, 22.9 percent of renters moved compared with only 5.0 percent of owners.
From a historical perspective, Figure 3 shows that renters experienced a greater decline in their mover rate compared to owners. Renters began with a mover rate of 35.2 percent in 1988. By 2016, this rate had fallen by over 10 percentage points, down to 22.9 percent. This represents a 35.0 percent decrease in the mover rate for renters between 1988 and 2016. The decline for owners was not nearly as steep, as 9.5 percent moved in 1988 compared to 5.0 percent in 2016. Despite the lower percentage point change, the percentage change between 1988 and 2016 was higher for owners at 46.0 percent. For more information on geographic mobility by tenure, consult historical table A-4.
The 2016 CPS ASEC geographical mobility detailed tables released on November 16 are presented at the national and regional level and include information on migration by selected characteristics, such as educational attainment, labor force status, household income, relationship to householder and major occupation group.
Share
 Yes
Yes
 No
NoComments or suggestions?


Top


