Native Hawaiian and Other Pacific Islander-Owned Businesses Grow Faster Than Firms Owned by Other Race Groups
Native Hawaiian and Other Pacific Islander-Owned Businesses Grow Faster Than Firms Owned by Other Race Groups
Although the number of businesses owned by Native Hawaiians and Other Pacific Islanders remains small relative to the numbers owned by other minority groups, their rate of growth in recent years certainly stands out.
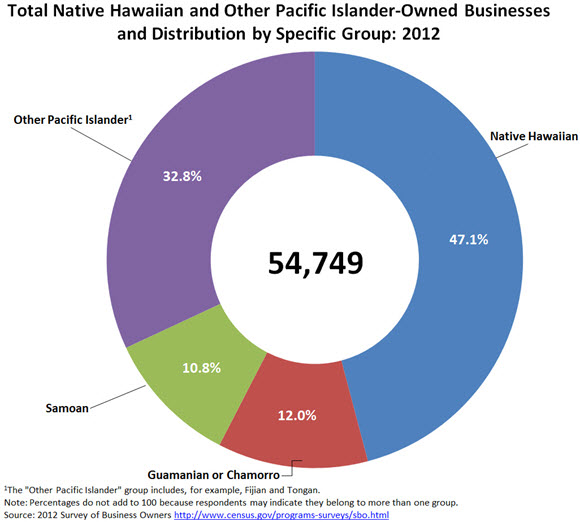
There were 54,749 Native Hawaiian and Other Pacific Islander-owned businesses across the country in 2012, up 45.3 percent from 37,687 in 2007. This rate of increase topped all race groups (except “some other race”) and far exceeds the rate for all U.S. firms (2.0 percent).
Receipts climbed 28.8 percent from $6.3 billion to $8.1 billion over the period, compared with 11.7 percent for all firms. The number of Native Hawaiian and Other Pacific Islander-owned firms topping $1 million in receipts reached 1,066 in 2012.
Furthermore, Native Hawaiians accounted for 25,774, or 47.1 percent of the race group’s firms and $4.5 billion in receipts, or 55.6 percent.
These statistics come from the Survey of Business Owners, which provides a broad socioeconomic picture of business owners across the nation and is part of the U.S. Census Bureau’s five-year economic census. Data are provided not only for this race group as a whole, but also separately for specific subgroups, including Native Hawaiian, Guamanian or Chamorro, Samoan and other Pacific Islander (for example, Fijian or Tongan).
Over half of Native Hawaiian and Other Pacific Islander-owned businesses in 2012 (28,983, or 52.9 percent) were in Hawaii or California. However, the three states rounding out the top five in the number of such businesses were far from the Pacific coast: Florida, New York and Texas. While Native Hawaiian and Other Pacific Islander-owned firms represented 0.2 percent of all businesses nationally, they comprised 12.3 percent in Hawaii.
Among the 50 most populous metro areas, Los Angeles, Calif, led with 5,023 Native Hawaiian- and Other Pacific Islander-owned businesses. New York was second with 3,328 and San Francisco-Oakland third with 2,812. Additionally, among the 50 most populous counties, Honolulu, Hawaii, was tops with 8,487 Native Hawaiian and Other Pacific Islander-owned businesses. Although most of the metro areas with the highest number of these businesses were found along or near the Pacific coast, some rather far-flung areas had appreciable numbers too. Some selected metro areas include Austin, Texas (with 227); Boston, Mass. (267); Cincinnati, Ohio (161); Miami, Fla. (1,401); Minneapolis-St. Paul, Minn. (301); Oklahoma City, Okla. (104), Raleigh, N.C. (116); Salt Lake City, Utah (678); and Washington, D.C. (694). Additionally, New York City, N.Y., had more Native Hawaiian and Other Pacific Islander-owned firms than any of the other 50 most populous cities: 2,092, with another 1,236 firms elsewhere in the metro area.
Native Hawaiian and Other Pacific Islander-owned firms were most commonly found in the Other Services sector (8,674). This sector includes such disparate industries as general automotive repair, beauty salons, funeral homes and funeral services, civic and social organizations and business associations.
Fewer than half of all Native Hawaiian and Other Pacific Islander-owned firms were women-owned (45.6 percent) in 2012.
This is just a small snapshot of data available from the Survey of Business Owners. These same data are available at the more specific industry level (down to the six-digit NAICS), and are broken out by employer and nonemployer firms and include additional variables such as size of firms by receipts and employment levels. Drawing on a sample of 1.75 million employer and nonemployer businesses, the Survey of Business Owners publishes data on the number of firms, receipts, payroll and employment, as well as the gender, ethnicity, race and veteran status of firm owners. Geographic detail, down to the economic place, is also available. This survey is the most comprehensive source of economic data on businesses by demographic characteristics of the owners.
Revisit this page for additional blogs about these data!


