American Indian and Alaska Native-Owned Businesses Move Past the Quarter-Million Mark
American Indian and Alaska Native-Owned Businesses Move Past the Quarter-Million Mark
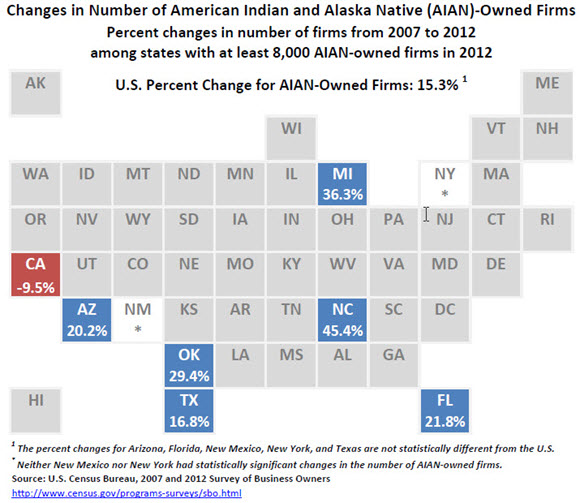
The number of American Indian and Alaska Native-owned businesses in the U.S. climbed by 36,228, or 15.3 percent, between 2007 and 2012, reaching 272,919. In Oklahoma, which ranked second among states with 27,450 American Indian and Alaska Native-owned businesses in 2012, the number of these businesses increased by 6,238 over the period, or 29.4 percent. As the “Sooner State” was experiencing an increase, first-place California (with 41,254 American Indian- and Alaska Native-owned firms) experienced a decrease of more than 4,000 (4,315 to be precise ─ a 9.5 percent drop), closing the gap between the states. These statistics come from the Survey of Business Owners, which provides a broad socioeconomic picture of business owners across the nation and is part of the U.S. Census Bureau’s five-year economic census.
Receipts for American Indian and Alaska Native-owned businesses totaled $38.8 billion in 2012. Roughly 5,000 (4,992) of these firms had receipts of $1 million or more. For American Indian and Alaska Native-owned firms, the rate of increase in the number of businesses (15.3 percent) topped the corresponding increase for all U.S. firms (2.0 percent).
Nationally, 1.0 percent of all firms were American Indian and Alaska Native-owned. There were several states, however, in which the percentage was more than double that: Alaska (11.0 percent), Oklahoma (8.4 percent), New Mexico (5.8 percent), Montana (2.7 percent), South Dakota (2.5 percent), Arizona (2.2 percent) and North Dakota (2.2 percent).
Returning to Oklahoma, American Indian and Alaska Native-owned firms comprised 5.4 percent of all businesses in the Oklahoma City metro area. Among the top 50 places (by population) Tulsa led with 6.6 percent, and Oklahoma City was second with 4.9 percent. Staying in Oklahoma, here are the proportions of businesses that were American Indian- and Alaska Native-owned in selected counties around the state: 37.1 percent in Adair, 32.2 percent in Cherokee, 19.7 percent in Choctaw, 5.0 percent in Oklahoma and 7.2 percent in Tulsa. In selected counties or equivalents elsewhere in the country, the proportion of firms that were American Indian- and Alaska Native-owned were 70.0 percent in the Aleutians East Borough, 68.1 percent in the Dillingham Census Area and 89.1 percent in the Wade Hampton Census Area (each in Alaska), and 52.8 percent in Apache, Ariz., home to the capital of the Navajo Nation.
Michigan and Rhode Island were the only two states in which both total population declined (according to population estimates) and the number of American Indian- and Alaska Native-owned businesses rose. Michigan’s total population declined by more than 100,000 people between 2007 and 2012 to 9.9 million, yet the state added 2,205 American Indian and Alaska Native-owned businesses to increase to 8,284 American Indian and Alaska Native-owned firms in 2012.
Among the 8,284 American Indian and Alaska Native-owned firms in Michigan, the largest sectors by number of firms included administrative and support and waste management and remediation services (899), construction (1,036), health care and social assistance (1,051) and other services (1,737).
In Rhode Island, total population declined by 4,922 to 1.1 million, while the number of American Indian- and Alaska Native-owned firms rose by 278 to increase to 673 in 2012.
The sectors in which American Indian and Alaska Native-owned firms were most commonly found nationally span the economy: other services (43,573 firms); construction (35,969); and professional, scientific, and technical services (30,966). In addition, about half (48.0 percent) of these firms were owned by women in 2012, up from 40.8 percent in 2007.
This is just a small snapshot of data available from the Survey of Business Owners. These same data are available at the more specific industry level (down to the six-digit NAICS), and are broken out by employer and nonemployer firms and include additional variables such as size of firms by receipts and employment levels. Drawing on a sample of 1.75 million employer and nonemployer businesses, the Survey of Business Owners publishes data on the number of firms, receipts, payroll and employment, as well as the gender, ethnicity, race and veteran status of firm owners. Geographic detail, down to the economic place, is also available. This survey is the most comprehensive source of economic data on businesses by demographic characteristics of the owners.
Revisit this page for additional blogs about these data!


