Changes Seen in Income Distribution for Women Ages 15 to 50 With Recent Births
Changes Seen in Income Distribution for Women Ages 15 to 50 With Recent Births
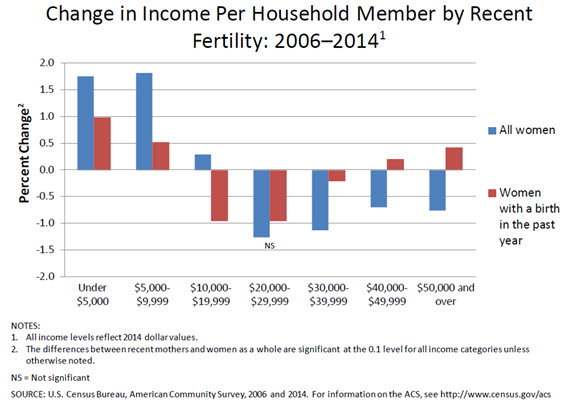
Despite the recent economic downturn, the proportion of women with a birth in the previous 12 months who reported the highest annual income per household member grew between 2006 and 2014. This is in contrast to the patterns for all women, for whom the percentage at the higher end of the income scale declined during this same period.
Today, the U.S. Census Bureau released new tables showing household income distributions for different subsets of women ages 15 to 50, focusing on trends for women with a birth in the previous 12 months.
Comparisons of individual income are problematic for women with a recent birth because many women take time out of the labor force around the time of a birth. Even household income measures are complicated due to the fact that while household income may not change in the context of a birth, the number of people who live on that income likely increases. Therefore, our tables do not include individual income and while they do include a measure of household income, we also include income per household member as an additional measure of well-being.
We look at income per household member in order to account for household size. A total household income of $100,000 per year, for example, means very different things if you are talking about a household of one person than it does if you are talking about a household of 10 people. Therefore, in order to compare the relative well-being of different households, we take the total household income and divide it by the number of people who live in that household to get the income per household member. This gives us a measure of income for each person and allows us to compare women across different household sizes and income levels – an income ratio.
Of course, women who had a birth in the previous 12 months are a minority of all women ages 15 to 50 and they generally live in lower income households and have lower income per household member than do women as a whole. However, when we look at change over time and differences between all women and the subset of women with recent births, the declines seen for all women over the period of 2006 to 2014 are not mirrored for women with a birth in the previous 12 months (see figure below). Recent mothers have a smaller proportional growth in the lowest income ratio categories than did women as a whole. Additionally, recent mothers saw an increase in the percentage who were in the uppermost income ratio.
There are several possible reasons for this. For example, the teen birth rate [PDF <1.0 MB] has fallen precipitously since the early 1990s. This decline in births among women who generally live in lower income households likely shifts the household income of women with recent births upward. Similarly, the National Center for Health Statistics [PDF 1.8 MB] reported an unprecedented rise in the age at first birth between 2009 and 2014. With fewer teen births, and first births happening later, the age of women with any birth is also likely older. As older women tend to live in higher income households than their younger counterparts, the changing demographics of women who are recent mothers could also explain the higher income per household member over time.
Additionally, a report from the Pew Research Center found that women’s fertility was affected by the recession that began in December of 2007, with fertility rates falling the most in states hardest hit by the recession. It may be that the women who reported a recent birth in 2014 opted into childbearing because they were more financially secure than the women who reported a recent birth in 2006.
For more information on household income and income per household member of women with a recent birth, please refer to the fertility tables at:


