Understanding How the Share of Business Activity by Size Varies Widely by Industry
Understanding How the Share of Business Activity by Size Varies Widely by Industry
We’ve all heard about the importance of small businesses to the U.S. economy, but have you ever wondered what “small” means? Is it a business with a few employees, or is it based on sales? Is it based on an entire company, or each of its separate locations?
The Small Business Administration (SBA) defines a small business as a “business concern with less than 500 employees or less than $7.5 million in annual receipts.” While this SBA standard is essential for specific purposes, it is not necessarily the only way to define “small.”
Fortunately, the Census Bureau publishes detailed statistics that allow us to classify business size in a variety of ways and for a variety of purposes. For example, the Economic Census, County Business Patterns, and the statistics of US Businesses produce data on establishment and firm size with respect to employment and sales for detailed industries and at the National, State, and local area levels. These data sources provide detailed breakouts that allow users to build their own totals using their own size definitions.
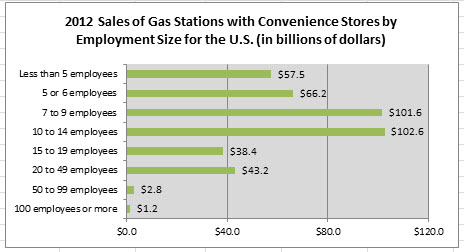
Looking at the data from the Retail Trade Establishment and Firm Size report from the 2012 Economic Census, we see that gas stations with convenience stores (NAICS 447110) with seven to 14 employees make up only 36.2 percent of the businesses (35,222 out of 97,394 businesses) but nearly half (47.8 percent or $204.2 billion out of $427.1 billion) of the sales of this industry. Conversely, businesses with less than five employees make up 28.9 percent (or 27,182 businesses) of the total businesses but only 13.5 percent of the sales (or $57.5 billion.)
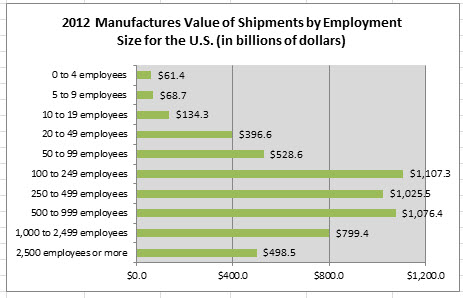
Comparing this breakout with the data for the manufacturing sector (NAICS 31-33), we see a dramatically different picture. While 44.0 percent of all manufacturing businesses have less than five employees (130,715 out of 297,191 businesses), these businesses account for only 1.1 percent ($61.4 billion out of $5.7 trillion) of total shipments. On the other hand, 56.3 percent of all manufacturing shipments ($3.2 trillion out of $5.7 trillion) are from locations with 100 to 999 employees, though these locations make up only 7.8 percent (23,291 out of 297,191) of the total number of manufacturing businesses.
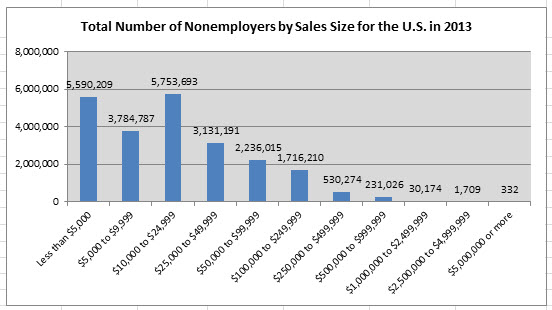
While most Census Bureau data on businesses focus on companies with one or more paid employees (or “employers”), we also publish data on businesses with no paid employees, or “nonemployers.” These “small” independent contractors (and similar businesses) are the bulk (23 out of 30 million)_of all U.S. firms. Looking at the data from the 2013 Nonemployer Statistics report, we see that businesses with less than $25,000 in annual revenue make up 65.8 percent (or $15.1 million) of all nonemployers.
These data can help users understand how the share of business activity by size varies widely by industry. Knowing this can help regional planners and economic development staff focus their limited resources on these key businesses and help small businesses grow. These data can also help business owners themselves better understand their own industry and compare their business to other businesses like them. Knowing this can help them with their business investment strategy by knowing what the “ideal” size of a business in their industry is and what to aspire to.