Women-Owned Businesses on the Rise
Women-Owned Businesses on the Rise
The number of women-owned firms rose 26.8 percent from 2007 to 2012, from 7.8 million to 9.9 million businesses. In contrast, the number of all firms increased 2.0 percent during the same period, from 27.1 million to 27.6 million.
Also on the rise, the increase in receipts for women-owned firms outpaced that of all firms during the period. Women-owned firms totaled $1.4 trillion in receipts in 2012, an increase of 18.7 percent from $1.2 trillion in 2007. Receipts for all firms grew 11.7 percent during the same period — from $30.0 trillion in 2007 to $33.5 trillion.
These statistics come from the Survey of Business Owners, which provides a broad socioeconomic picture of business owners across the nation and is part of the Census Bureau’s five‑year economic census.
Even though women business ownership is on the rise, male-owned businesses continued to make up the majority, with 53.7 percent of all firms (14.8 million businesses), while female-owned businesses comprised 35.8 percent of all firms (with 9.9 million businesses). Equally male-/female-owned businesses comprised 8.9 percent (with 2.5 million businesses) and 1.6 percent (with 0.4 million businesses) were publicly held/not classifiable by gender (or ethnicity, race and veteran status).
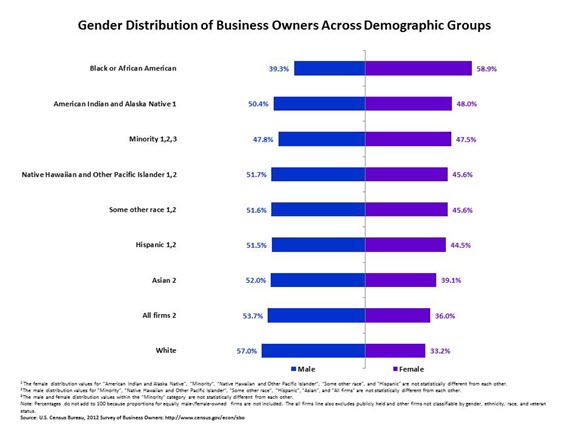
Overall, women owned over a third of all firms in 2012, but the proportion was greater among minorities and varied by group. (See figure below.) The 8.0 million minority-owned firms were almost equally distributed between male- and female-owned, with 3.8 million firms each (0.4 million minority-owned firms were equally male-/female-owned).
Among minority groups (non-white races and Hispanics), only one group had more female-owned businesses than male-owned: Black/female-owned accounted for 58.9 percent (with 1.5 million businesses) of the nation’s 2.6 million black or African American-owned businesses. While over half (52.0 percent) of Asian-owned businesses were male-owned (996,606 out of 1,917,902), there were a couple of Asian subgroups (based on nationality) that were majority women-owned. Women-owned businesses accounted for over half (51.1 percent) of both Vietnamese- and Filipino-owned businesses (with 158,958 out of 310,864 Vietnamese-owned businesses and 98,849 out of 193,336 Filipino-owned businesses). In contrast, white/female-owned firms made up 33.2 percent (or 7.2 million firms) and white/male-owned firms made up 57.0 percent (or 12.3 million firms) of all white-owned firms in 2012.
The proportion of women-owned businesses varied by location. The District of Columbia ranked higher than any of the 50 states in 2012 in female-business ownership. In DC, 42.7 percent (or 27,064 out of 63,408) businesses were women owned. This was an increase of 40.3 percent from 19,291 women-owned businesses in 2007. Bronx County, N.Y., had the highest proportion of women-owned businesses among the 50 most populous counties in 2012, with half of all firms (50.6 percent) owned by women (68,705 out of 135,782 businesses). Also in 2012, Detroit ranked first among the 50 most populous cities for the proportion of women-owned businesses, with 62.4 percent (or 38,576 out of 61,868 businesses).
The proportion of women-owned businesses by kind of business also varied among economic sectors. Women-owned businesses accounted for over half of all firms in the following three sectors: health care and social assistance (NAICS 62) with 62.5 percent (or 1.6 million out of 2.6 million firms), educational services (NAICS 61) with 54.2 percent (or 0.4 million out of 0.7 million firms), and other services (NAICS 81) with 51.8 percent (or 1.9 million out of 3.6 million firms).
This is just a small snapshot of data available from the Survey of Business Owners. These same data are available at the more specific industry level (down to the 6-digit NAICS), are broken out by employer and nonemployer firms, and include additional variables such as size of firms by receipts and employment levels. Drawing on a sample of 1.75 million employer and nonemployer businesses, the Survey of Business Owners publishes data on the number of firms, receipts, payroll and employment, as well as the gender, ethnicity, race and veteran status of the firm owners. It is the most authoritative source of economic data on businesses by the demographic characteristics of the owner.
The first results from the 2012 Survey of Business Owners were released last year. This blog is part of an analytical series that takes a deeper dive into the Survey of Business Owners data for different demographic groups. Future blogs will focus on race, ethnicity, veteran status, and other characteristics, such as age of business owner.


