An official website of the United States government
Here’s how you know
Official websites use .gov
A .gov website belongs to an official government organization in the United States.
Secure .gov websites use HTTPS
A lock (
) or https:// means you’ve safely connected to the .gov website. Share sensitive information only on official, secure websites.
-
//
- Census.gov /
- Census Blogs /
- Random Samplings /
- County-Level Nutrition Assistance Program Data are a Collaboration Between Government Agencies
County-Level Nutrition Assistance Program Data are a Collaboration Between Government Agencies
County-Level Nutrition Assistance Program Data are a Collaboration Between Government Agencies
Today, the U.S. Census Bureau released the 2014 Small Area Income and Poverty Estimates (SAIPE) for all school districts, counties, and states. These estimates are used to allocate federal funds to school districts for the next school year. Also released today were counts of Supplemental Nutrition Assistance Program participants at the county and state levels for most years between 1989 and 2013. These counts are drawn from the source data of the SAIPE, and are the only source of SNAP participant total all U.S. counties.
Formerly known as the Food Stamp Program, SNAP is a nutrition assistance program for low-income individuals and families administered by the U.S. Department of Agriculture’s Food and Nutrition Service. The Food Stamp Act of 1977 requires that states report the number of SNAP participants by program area to USDA each year. USDA receives and makes available county-level SNAP data from roughly half of all states. In order to obtain and validate county-level data for the remaining states, each year a team of Census Bureau staff members collaborates with USDA and state government agencies.
By utilizing other Census Bureau population data, data users can create SNAP statistics by metropolitan statistical area status and by census region [PDF 1.1 MB]. Table 1 presents SNAP participation rates, shares of SNAP participants, and shares of population by metropolitan statistical area status and by census region. We compute the SNAP “participation rate” as the number of SNAP participants divided by the population size.
Table 1. SNAP and Population Data by Metro Area Status and by Region
Source: U.S. Census Bureau. Based on authors’ calculations, using SNAP data, population estimates, and metropolitan statistical area definitions.
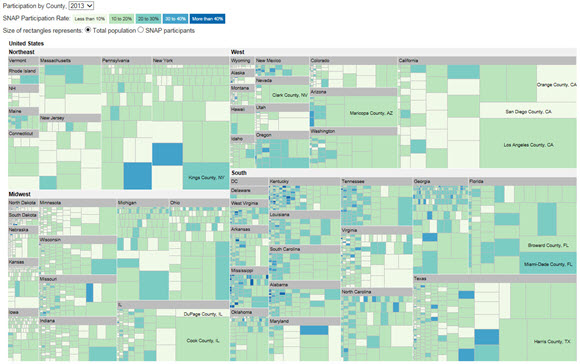
The SNAP data are also available in our new interactive treemap web tool for years 2013 back through 2000.
Figure 1. Screenshot of Treemap of 2013 SNAP Participation Rates
Figure 1 displays a screenshot of the interactive treemap of the 2013 SNAP participation rates. The treemap allows the data user to click on an individual box to view the specific county-level data. The larger the box for a given county, the greater the number of people or SNAP participants (depending on the selection) who reside there. Also, each box is color-shaded to indicate the SNAP participation rate range for the corresponding county.
The county and state SNAP data sets we have discussed here are available for download from the data input area of the SAIPE program website. Data users can reach our office with any questions or comments at sehsd.saipe@census.gov or at 301-763-3193.
Share
 Yes
Yes
 No
NoComments or suggestions?


Top


