An official website of the United States government
Here’s how you know
Official websites use .gov
A .gov website belongs to an official government organization in the United States.
Secure .gov websites use HTTPS
A lock (
) or https:// means you’ve safely connected to the .gov website. Share sensitive information only on official, secure websites.
-
//
- Census.gov /
- Census Blogs /
- Random Samplings /
- Taking a Look at Veterans Across America
Taking a Look at Veterans Across America
Taking a Look at Veterans Across America
As we celebrate those who have served in the U.S. Armed Forces this Veterans Day, many Americans may want to learn more about the veterans who live in and around their area. Today the Census Bureau released a series of infographics detailing characteristics of veterans within each state, the District of Columbia and Puerto Rico.
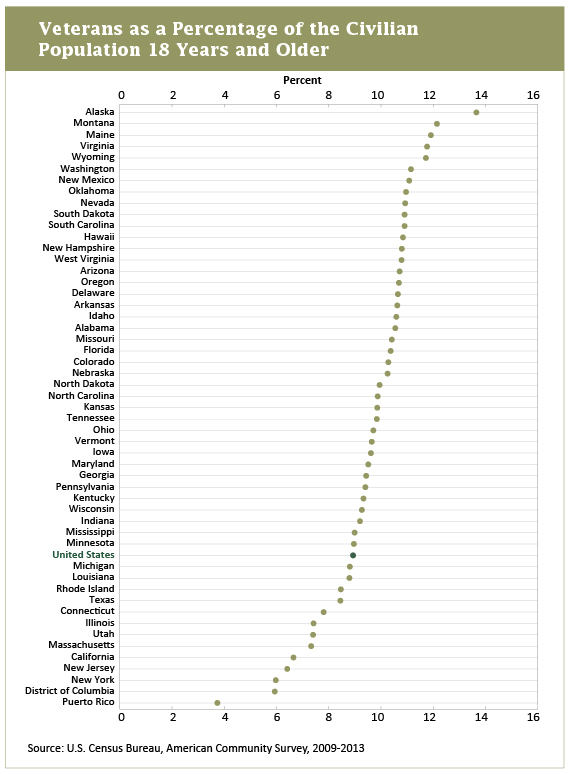
Statistics based on American Community Survey data collected from 2009 to 2013 show 21.3 million veterans living in the United States and Puerto Rico, comprising 9 percent of the civilian population. Alaska had the highest proportion of its population who were veterans, at 13.8 percent. Puerto Rico, at 3.8 percent, reported the lowest proportion of veterans.
Veterans as a Percentage of the Civilian Population Age 18 and Over, by State, 2009-2013
Among veterans, 7.3 percent were women. According to the Department of Veterans Affairs, women are the fastest growing subpopulation within the veteran community. Alaska and Virginia had the highest proportions of female veterans, at about 12 percent of the civilian population in each state. Alaska and Virginia were also among the states with the highest proportions of total veterans. Industry and economic concentrations and opportunities, as well as cultural dynamics within these two states may help explain such high concentrations of veterans. Both states are home to several military bases, which may provide a welcoming and familiar community for the men and women who served there.
Educational attainment is another characteristic highlighted in these infographics. Twenty-six percent of veterans had a bachelor’s degree or higher during the 2009-2013 period. Forty-four percent of veterans in the District of Columbia had a bachelor’s degree or higher – the highest rate in the nation. Virginia, Colorado, Maryland and Utah were the top four states with the highest proportion of veterans with a bachelor’s degree or higher. Several of these states also reported comparably high educational attainment for nonveterans.
Veterans were more likely to have health insurance coverage than nonveterans during the 2009-2013 period; 6 percent of veterans and 18.6 percent of nonveterans were uninsured during this time. The veteran population is substantially older, as a group, than nonveterans, which may account for higher rates of health care coverage. Many are also eligible to receive medical coverage through the Department of Veterans Affairs health care system. Massachusetts reported the lowest rate of uninsured veterans, at 2 percent, which is not surprising since the uninsured rate for nonveterans was also lowest in Massachusetts.
According to the latest statistics from the Survey of Business Owners, 2.5 million businesses in the United States were veteran-owned in 2012. These accounted for 9.2 percent of all firms in the nation. The proportion of total firms that were veteran-owned in each state ranged from 6.9 percent to 13.2 percent, with New York having one of the lowest rates and South Carolina having one of the highest rates.
To view these statistics along with other social and demographic statistics for veterans living in your state, please visit www.census.gov/library/infographics/veterans-statistics.html. For more information on veterans, please visit www.census.gov/topics/population/veterans.html.
Share
 Yes
Yes
 No
NoComments or suggestions?


Top

